Feeds:
Posts
Comments

Posts Tagged ‘Kobe Bryant’

I’m a big fan of On/Off data, which compares a team’s point differential with a player on the court versus when he’s off the court. I’ve referenced it frequently in the past and think it’s one of the more telling reflections of a player’s value to his team in the advanced stat family.

The nice part about On/Off is that it represents what actually happened. The problem with On/Off is it ignores the reasons why it happened. And sometimes, it creates a fuzzy picture because of it.

For example, let’s suppose Kobe Bryant plays the first 40 minutes of the a game and injures his ankle with the score tied at 80. LA wins the game 98-90. The Lakers were dead even when he was in the game, and +8 with him out of the game – Bryant’s on/off would be -8.

In this case, sample size is an issue. But that becomes less of a problem over the course of an entire season. The real concern is the normal variance involved in everyone else’s game. Practically speaking, it takes little outside the norm for Kobe to have played 40 brilliant minutes while his teammates missed a few open shots, and for the opponent to miss a few open shots down the stretch while Kobe’s teammates start hitting them.

The tendency is to look at a result like that and conclude that Kobe hurt his teammates’ shooting and when he left the game it helped their shooting. He very well may have by not creating good looks for them.

Then again, players hit unguarded 3-pointers about 38% of the time. Which means if the average shooter attempts five open 3-pointers, he will miss all five about 10% of the time, simply based on the probabilistic nature of shooting. A fact that has little to do with Kobe or any of the other players on the court.

In our hypothetical situation, all it takes is an 0-5 stretch from the opponent and a 3-5 stretch from LA to produce Kobe’s ugly -8 differential. The great college basketball statistician Ken Pomeroy ran some illuminating experiments on the natural variance in such numbers. His treatise is worth the read, but the gist of it is that his average player — by definition — produced a -57 on/off after 28 games (-5.7 per game) due to standard variance in a basketball game outside of that player’s control. Think about that.

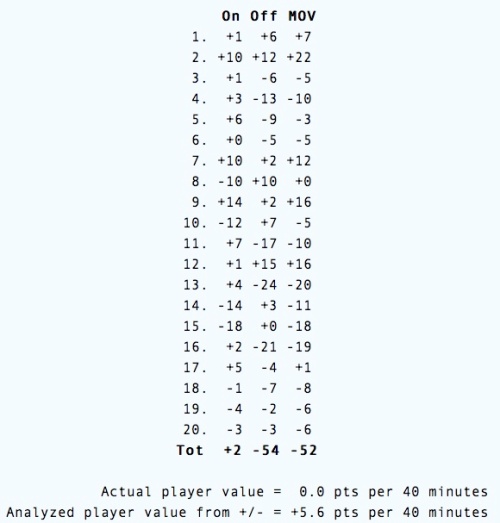
For fun, I just ran the same simulation and my average player posted a +5.6 rating of his college season:

Average Player Simulation

So in two simulations, the average player’s On/Off ranged from -5.7 to +5.6. One guy looks like an All-Star, the other like an NBDL player.

“The Team Fell Apart When Player X Was Injured”

This is a common argument for MVP candidates: Look at how the team fared when he missed a few games and conclude the difference is the actual value a player provides to his team. Only this line of thinking runs into the same problems we saw above with on/off data.

Let’s take Dirk Nowitzki and this year’s Dallas Mavericks. In 62 games with Dirk, Dallas has a +4.9 differential (7.8 standard deviation). In nine games without Dirk, a -5.9 differential (7.5 standard deviation).

Which means, with a basic calculation, we can say with 95% confidence that without Nowitzki, Dallas is somewhere between a -1.0 and -10.8 differential team. Not exactly definitive, but in all likelihood they are much worse without Dirk. OK…but we can’t definitively say how much worse they are.

In a small sample, we just can’t be extremely conclusive. In this case, nine games doesn’t tell us a whole lot. New Orleans started the season 8-0…they aren’t an 82-win team.

We can perform the same thought-experiment with Dirk’s nine games that we did with Kobe’s eight minutes to display how unstable these results are. Let’s say Dallas makes three more open 3’s against Cleveland and the Cavs miss three open 3’s. What would happen to the differential numbers?

  1. That alone would lower the point differential two points per game.
  2. Our 95% confidence interval now becomes -12.1 points to +4.4 points.

That’s from adjusting just six open shots in a nine game sample.

Jason Terry — a player who benefits from playing with Dirk Nowitzki historically — had games of 3-16, 3-15 and 3-14 shooting without Dirk. He shot 39% from the floor in the nine games. By all possible accounts, Terry is better than a 39% shooter without Nowitzki. He shot 26% from 3 in those games. Let’s use his Atlanta averages instead, from when he was younger and probably not as skilled as a shooter: How would that change the way Dallas looks sans-Dirk?

Well, suddenly Terry alone provides an extra 1.7 points per game with his (still) subpar shooting. The team differential is down to -2.2 with a 95% confidence interval of -10.4 to +6.1. Just by gingerly tweaking a variable or two, the picture grows hazier and hazier.

Making Sense of it All

So, what can we say using On/Off data? It’s likely Dallas is a good deal better with Dirk Nowitzki. But, hopefully, we knew that already.

To definitely point to a small sample and say, “well this is how Dallas actually played without Dirk, so that’s his value for this year” ignores normally fluctuating variables — like Jason Terry or an open Cleveland shooter — that have little to do with Dirk Nowitzki’s value. So while such data reinforces how valuable Dirk is, we can’t say that’s how valuable he is.

We can’t ignore randomness and basic variance as part of the story.
Read Full Post »

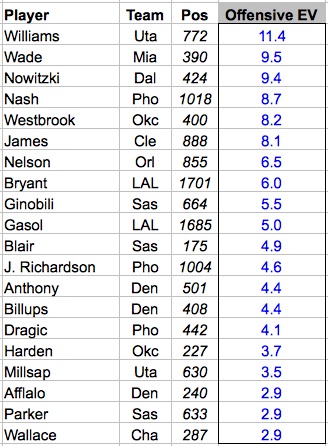
In the last post, we looked at the leaders in Expected Value (EV) on the defensive side of the ball for the 2010 playoffs. Not surprisingly, Dwight Howard was the winner there. Now let’s look at the offensive leaders in EV from the 2010 playoffs. There are three notable additions to the classic box score involved in that calculation:

“Help Needed” includes all of the points scored that were created by a teammate. I will have a post about it in the near future, but for now, think of Kobe Bryant driving down the lane and drawing hordes of defenders (an OC), setting up Andrew Bynum for an open dunk. In that case, Bynum’s dunk loses some value because it was created by another teammate. More on this in the future, though.

Here are the leaders in offensive EV from the 2010 playoffs, minimum 300 possessions played. All EV values are relative to league averge:

Offensive EV Leaders, 2010 Playoffs

As always, with playoff data, it’s important to remember particular matchups. Last year, Deron Williams dissected a soft Denver defense and then he made Derek Fisher look like an AARP member. Utah actually boasted the second best Offensive Rating in the playoffs — 114 pts per 100 possessions — but the defense let them down mightily. Here is the complete list of leaders in Offensive EV from the 2010 playoffs, minimum 300 possessions played.

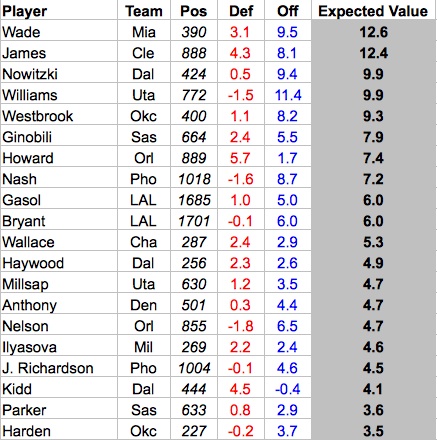
Finally, we can combine the defensive and offensive components and view the overall Expected Value leaders from the 2010 playoffs:

2010 Playoffs, min 150 possessions; Def=Defensive EV; Off=Offensive EV

By just about any measure, Dwyane Wade had a fantastic series against Boston’s vaunted defense. LeBron James’ second round against Boston wasn’t quite as good (8.5 EV), but he tortured Chicago in the opening series. Of the three superheroes, Kobe had it the worst of against Boston, posting a 3.4 EV in the Finals.

For reference, the top series performances by EV from the 2010 playoffs (EV in parentheses):

  1. James vs. Chi (16.2)
  2. Gasol vs. Uta (12.8)
  3. Howard vs. Atl (12.5)
  4. Nelson vs. Cha (12.5)
  5. Wade vs.Bos (11.8)
  6. Bryant vs. Pho (11.8)
  7. Nash vs. SAS (10.8)
  8. D Will vs. Den (10.2)
  9. Dirk vs. SAS (9.3)
  10. James vs. Bos (8.5)

Paul Gasol had the highest EV of the 2010 NBA Finals (5.0). Here is the complete list of EV leaders from the 2010 playoffs, minimum 150 possessions played.

Read Full Post »

A poster on the realgm forums named Nonemus recently wondered how everyone’s favorite triumvirate of wings, Kobe Bryant, LeBron James and Dwyane Wade, have stacked up against elite teams in the playoffs. Some of the numbers are worth examining here, namely how these three have performed against defenses separated by quality. Are any of them bottom-feeders? Do they equally suffer against the best defensive teams? Has one played a disproportionately large amount of games against amazing defenses?

First, we need to define elite defenses. Since the rule changes in 2005, only 41 teams have posted a defensive rating of 104 or lower. Which means, on average, a 104 DRtg is about the 6th best defense in the league and roughly three points better than average. Certainly a fair cutoff point with which to work. Similarly, let’s call “solid” defensive opponents those with a DRtg between 104 and 107 (roughly better than average), and “bad” defenses having below average Defensive Ratings (lower than 107).

Using that distinction, it turns out Dwyane Wade has played the majority of his playoff games against elite defenses (68% of all games versus such teams). LeBron has played 42% against top defenses and Kobe 38%. Below are their statistics, per 36 minutes, broken down by defensive quality. (GmSc is their Game Score).

Fittingly, Bryant and James show improvement the easier the defensive foe. Wade, however, has some surprising results. His performance versus elite D and non-elite D isn’t too different. (Note, those six games against “solid” defenses are from the 2006 Finals against Dallas.) He quite clearly outperforms the other two against elite defensive teams, even ramping up his three-point % and assists.

LeBron’s history against elite defensive teams is a tale of two players. In his first 15 games against such opponents, James struggled mightily, to put it mildly. He was dreadful, posting a 45.9% TS percentage and averaging over four turnovers per 36 minutes. Hide the women and children.

Below are his splits — the first 15 games are against 2006 Detroit, 2007 San Antonio and the first four games against Boston in 2008:

So James has been a different player against top defenses since game 5 against Boston back in 08, scoring and shooting better than he has even against solid defenses and posting a monstrous Game Score that tops Wade’s or Bryant’s GmSc against even the weakest defenses. The lesson, as always, is that LeBron James has been really good for the last few years.

Here is how each player’s series looks visually, measured using Game Score. The x-axis is a team’s defensive rating and y-axis the players average GmSc for the series:

The coefficient of correlation between Game Score and Opponent Defensive rating is as follows for each player:

  1. LeBron .582
  2. Kobe .561
  3. Wade .409

Which implies that LeBron’s Game Score by series is the most heavily influenced by opposing defense and Wade’s is the least affected. That is, the more positive correlation suggests that as the defense is worse, the performance better. That bottom-feeding trend is the strongest in LeBron’s case, and can be seen above with all his data points in the upper right quadrant.

All of this begs the question: Is it better for performance to vary according to defensive strength, or better to remain consistent regardless of opponent quality? In his only two series against bad defensive teams, Wade shows no appreciable improvement. LeBron and Kobe feed off bad defenses, to a certain degree.

In the playoffs, teams can expect to encounter difficult defenses on the path to a title. Since the inception of the three-point line in 1980, only five teams with an SRS over 6 had a defensive rating over 107. And 58% of those 6+ SRS teams qualified as “elite,” with a DRtg of 104 or lower. Which means in this case, Dwyane Wade may provide a distinct advantage on the game’s biggest stage.

Here is a complete list of each players series against elite defenses in the playoffs since 2005.

Read Full Post »

When I was growing up, a “closer” was a term reserved for baseball pitchers. Specialists with strange facial hair who were only used when their teams protected narrow leads and needed three outs to finish the game.* Then a closer became someone with enough machismo to finish real estate deals. Kyra Sedgwick turned out to be The Closer. And finally, it devolved into a basketball term.

*I never understood the decision not to use closers when teams were behind by a run. Why opt for a lesser pitcher simply because a save opportunity wasn’t available?

In the NBA, a “closer” refers to star players who play well down the stretch of close games. Give them the ball, and they will guide a team to victory. Simplify the game and ride the best player to victory.

In other words, the best closers are the best offensive anchors at the end of tight games. So naturally, unless there is a drastic difference between normal performance and late-game performance, the best closers will be the best overall offensive players in the game.

Some people believe that clutch performance varies wildly in professional sports. That pro athletes are wired differently, some live for big moments and others shrink in them. And there is quality reasoning behind that thinking. So, when something like this starts rolling, it’s hard to stop its momentum:

It didn’t stop there. Mark Jackson kept calling Kobe Bryant the best closer during game coverage. Skip Bayless has echoed it. This informal 2009 poll of players agreed that Kobe was the King of Clutch.

Kobe’s shortcomings in such situations have been extensively documented. The meme floating around that he’s the de facto best closer/clutch player in the league is actually less erroneous than its evil twin, the Un-Clutch meme. That has been slapped on undeserving players like Karl Malone and Kevin Garnett before, and now it follows LeBron James.

Only LeBron James is plenty clutch. Actually, he’s the best closer in basketball. And it’s not even really close.

In the first batch of clutch numbers I crunched from 82 games, looking at the final 5 minutes of 5-point games or closer, LeBron practically lapped the field. In 477 minutes of closer duty from 2008 to 2010, LeBron’s Cavs were +27.2 per 36 minutes. That is mind-boggling, given that the best NBA teams in history are about +9 per 36 minutes. It’s even more superhuman when one considers how they’ve completely crumbled as a team without James.

He managed to score, rebound and distribute down the stretch of close games while shooting 10% better than league average in eFG%. Holy Superman, Batman! Frankly, he looks like the best player in NBA history based on his closer line.

The next set of numbers looked at playoff performances in such situations. Again, James showed the same pattern: his scoring, shooting and assist numbers spiked. Of the players examined in that post, only one other (Carmelo Anthony) improved his playoff shooting in the clutch, and only Steve Nash averaged more assists. Of course, LeBron scored at nearly double Nash’s rate.

It’s almost as if most of LeBron’s value is disproportionately unleashed at the end of close games. He is, in many ways, the ultimate closer.

Yet the indestructible meme following LeBron is that he’s not a closer.

Some argue that he’s too unselfish at the end of games. But he actually shot the ball more frequently than anyone from 2008-2010, including Kobe Bryant. He has attempted 69 attempts in the final 24 seconds of close games according to this ESPN study, which is about 10 per year. Again, more than anyone on the list.

Even his free throw shooting is refined when he’s closing. 81% on 187 free throw attempts from 2008-2010, up 6.3% from all other situations. He made 20 consecutive late-game free throws this year before missing one two weeks ago. The last time 82games ran “super clutch” numbers (final 2 minutes of a 3-point game), LeBron was in video-game land.

Last week, Kevin McHale opined on NBATV that Miami should have LeBron be a distrbutor down the stretch and let Wade be the team’s closer. Skip Bayless loves to slam his ESPN desk and note how Wade is a great closer and LBJ isn’t.*

I don’t know what it will take to kill those ideas. I suspect the way to destroy the Un-Clutch meme is to win a championship. Hopefully, In the meantime, this is a start.

*If pressed, here are my late-game offensive player rankings since 2003. Note Wade’s absence:

  1. LeBron James
  2. Steve Nash
  3. Kobe Bryant
  4. Manu Ginobili
  5. Chris Paul

Read Full Post »

In the last post, I looked at nine of the most explosive wing scorers of the past 25 years. In a 40-point game, the ball has to go in the hole frequently, thus, TS% is quite good on average in such games. But what about removing scoring from the equation and simply looking at shooting volume?

High-Volume Shooting

Let’s use field goal attempts to examine what happens when these players shoot a lot, setting the cutoff at 30 or more FGA’s in a game. These are high-volume attempt games, in which efficiency counts more than lower volume games.

Returning to variance, here are the standard deviations for the same nine players in 30+ FGA games. “Stdev” is the standard deviation for the statistic to its left:

Again, LeBron James is a beacon of consistency, although he only shoots 30+ shots about once in every 20 games. LeBron also shoots the ball much, much, much better than anyone else when he shoots it this much. Note the ridiculous TS%.

So does that translate to team success? Actually, no. The ONLY player of these nine perimeter scoring-machines to see his team’s win% increase when he shoots the ball so much is…you guessed it, Allen Iverson. (Kudos if you actually guessed it.) Below are the results, along with frequency of 30-shot games and relative true shooting percentage (Rel TS%):*

This, despite Iverson having a break-even relative TS% (only Wilkins was worse relative to the league environment in such games). Which hits at the volume-efficiency tradeoff argument, because Iverson seems to be a player who can increase his volume — here, 95 of 561 games (16%) with over 30 attempts — and maintain similar efficiency to his normal standard. That’s not a ringing endorsement for Iverson as a team cog, but it certainly helps to justify his role and value in a system like Philadelphia’s.

On the opposite end of the spectrum is Kobe Bryant, whose teams suffer mightily when he shoots the ball a lot. And, unfortunately, he’s done this about every eight games in his career. Bryant’s relative TS% in such games is almost 3% off his normal average in the same time period, and his scoring varies greatly. (How many players have a 40-point difference between their two highest FGA games?)

This is further evidence that good players can shoot too much. All of these stars, except for Allen Iverson, see a drop in their team win% in high-volume attempt games. Some might cry chicken-and-egg; Are the star players suddenly shooting this much because the team is losing, or are they losing because of so much shooting? There is ample evidence that one player going rogue, or worse, forcing shots doesn’t help an offense in the first place. Being behind is no excuse to abandon ship and undertake a flawed strategy.

Coming full circle, as far as I know, there isn’t a single advanced metric that considers variance. Nor is there an advanced metric that takes into account team strength in matters like variance and volume. Means are beneficial, but wins are tallied after 48 minutes. It’s not like overall point differential — while a great predictor — determines playoff seedings. Perhaps we should look beyond averages and weigh consistency and team strength against those averages in individual player analysis.

*Relative TS% and win% difference are weighted by year. For eg, if half of one’s 40-point games were in a single season, that one season’s TS% and win% differential accounted for half the weight in both categories.

Read Full Post »

In the last post, I examined different measures of variance in this generation’s Mt. Rushmore of wing players, LeBron, Kobe, Wade and Michael Jordan, all the while keeping in mind that it’s possible for inconsistent play to result in a few more wins on weak teams and fewer wins on good teams.

Of those four superstars, Kobe Bryant had the most games with “inefficient shooting” (under 50% True Shooting) and the fewest games with “efficient” shooting (over 60% True Shooting). However, we ignored the amount of shots he attempted when he was shooting poorly or shooting well. Turns out, all four players shoot more when they’re shooting poorly. And of the group, Dwyane Wade has the biggest increase in FGA’s per 36 minutes in his inefficient shooting games. In order of change in FGA’s per 36 from good games to bad:

  1. Wade +1.2 (17.6  in good shooting games to 18.8 in bad ones)
  2. Kobe +0.9 (19.1 to 20.1)
  3. Jordan +0.4 (21.7 to 22.1)
  4. LeBron +0.2 (18.7 to 18.9)

Before we focus on attempts any further, let’s first look at what happens when elite wings score a lot.

High Volume Scoring

There have been just nine wing players with at least 25 40-point games since 1987 (the beginning of Basketball-Reference’s game logs):

  • Michael Jordan
  • Dominique Wilkins
  • Allen Iverson
  • Vince Carter
  • Kobe Bryant
  • Tracy McGrady
  • Gilbert Arenas
  • LeBron James
  • Dwyane Wade

We have our four usual suspects and five more players who collectively amassed 35 All-Star game appearances and 26 All-NBA nods. Not too shabby. Here is the volume and frequency of 40-point games from this group during their prime scoring years:

Not surprisingly, the greatest scorer in NBA history, Michael Jordan, dropped 40 in nearly one in every five games during his prime years. Yikes. Although Jordan isn’t the most efficient of the bunch in such games. That would be Gilbert Arenas, who boasts nearly 70% True Shooting in his 40-pointers:*

As expected, all these players increase their efficiency in 40-point games. Although Kobe’s shooting numbers are surprisingly low, residing next to someone labeled as an inefficient “chucker,” Allen Iverson. So Iverson and Kobe must not be helping their teams win those big games as much as their contemporaries. Right?

Wrong.

It turns out that Iverson’s teams actually improved the most when he scored 40 or more!*

In Iverson’s 72 40-point games, Philadelphia’s win% improved by nearly 20%. That’s a startling contrast – about 16 extra wins over the course of a season. But why would Iverson’s teams improve so much when he has the lowest relative TS% of the lot?

If we buy the argument that AI’s 76er teams lacked a scorer who could create his own offense — certainly a reasonable stance — then Iverson’s scoring explosions shored up that offensive deficiency and buoyed them to victory more often than his run-of-the-mill 25 or 30-point nights, regardless of the drop in efficiency relative to his peers. (This somewhat echoes Paine’s Monte Carlo run.) Besides, AI’s shooting efficiency in such games is still significantly better than both the league average and his own career average.

There’s also further evidence here supporting the idea that weaker teams are helped more by big performances: Jordan played on the best teams in this time period (win% with MJ in the lineup of .713) and saw the smallest change in team W-L when going for 40. From 1990-1998, once Chicago ascended to elite team status, the Bulls were 68-20 when Michael went for 40 or more, for a .772 win%. Slightly worse than his team’s .779 win% (387-110) when he didn’t go for 40.

Tracy McGrady played on the second worst teams of these nine players (Arenas the worst). When McGrady was in Orlando (01-04) the Magic went 19-11 (.633) in his 40-pointers. 121-144 (.457) in his other games. Then he went to a better Houston Rocket team, and went 7-4 (.636) in 40-point games and 119-66 (.643) in other games.

The same reasoning explains why LA has faired so well despite Kobe’s lower efficiency numbers; Many of Bryant’s games were in 03, and 05-07 when his team needed volume scoring. LA was 50-24 (.676 win%) in his 40-point games in those years, while going 112-119 (.485) in Kobe’s non-40 games. (In the other seasons, a .724 win% in his 29 40-point games and a .715 win% in all other games.)

So these players are helping bad teams with big scoring nights and not doing much for good teams with the same outbursts. Balance, it seems, is indeed better.

Yet we haven’t completely addressed the issue of what happens when players shoot a lot. That is the topic of Part III

*Relative TS% and win% difference are weighted by year. For eg, if half of one’s 40-point games were in a single season, that one season’s TS% and win% differential accounted for half the weight in both categories.

Read Full Post »

Last June, Neil Paine over at Basketball-Reference examined consistent vs. inconsistent performances by Kobe Bryant and LeBron James vs. the Boston Celtics. Using one catch-all metric (statistical plus-minus), James and Bryant had similar average performances over the course of their series. But their game-to-game performances varied greatly; James was high-variance — some great games and some awful ones — while Bryant was steadier throughout. If we buy Neil’s simple Monte Carlo simulation, his findings were:

  • Good teams are helped more by a consistent player
  • Average teams are helped more by a consistent player
  • Bad teams are helped more by a high-variance player

This makes sense to a certain degree; Big performances by stars can boost bad teams to wins they otherwise wouldn’t have had, and the bad performances still result in losses they probably would have incurred anyway. In theory, the inverse would hold true for good teams and really bad performances by stars.

Last year’s NBA Finals aside,  Bryant is actually more high-variance than James using measures like points, FG% and GameScore. (GameScore is a rough measure of productivity for a single game.) Below is a comparison of variance between the best wings of my lifetime, Kobe (2001-2010), LeBron (2006-2010), Dwyane Wade (2006-2010) and Michael Jordan (1987-1998):

“Stdev” is the standard deviation of the statistic to its left. If we use a summary statistic like GameScore, LeBron wins the consistency battle handily. Jordan would place second by virtue of his ridiculous 25.3 average GameScore, then Wade and Kobe by the same logic.

If we focus on consistency of shooting and scoring, LeBron wins again. (LeBron outpacing the field is becoming a theme on this blog.) Of course, one could argue LeBron played with a weaker team from 2006-2010, so higher variance would be better when compared to Kobe and Jordan. But unlike Neil’s Monte Carlo run, LeBron’s averages are significantly higher than Kobe’s and Wade’s to begin with.

Kobe, not surprisingly, is higher variance with his FG% — easily the lowest of the lot — and in particular with his scoring performances. But only looking at standard deviations overlooks the importance of the averages. A lower average means more poor shooting games.

EDIT: Bryant’s GameScore standard deviation is 9.5 (mean 22.0) from 2005-2007 on his “weak” teams.

Another way to view consistency is by frequency of games, delineated in a specific range. For instance, we can call games over 60% True Shooting (TS) “efficient” shooting games and games under 50% TS “inefficient” shooting games.

Player Efficient Games (> 60% TS) Inefficient Games (< 50% TS)
Michael Jordan 41.4% 20.5%
LeBron James 40.1% 21.6%
Dwyane Wade 37.8% 26.7%
Kobe Bryant 35.3% 29.3%

Now Bryant’s shooting inconsistency can be seen more clearly. While James and Jordan have an efficient game twice as often as an inefficient one, Kobe shoots well a little more than 1/3 of the time, and shoots poorly a little less than 1/3 of the time. And, if we come full circle to the original claim about consistency helping good teams, that doesn’t bode well for Kobe Bryant’s impact on wins relative to his averages.

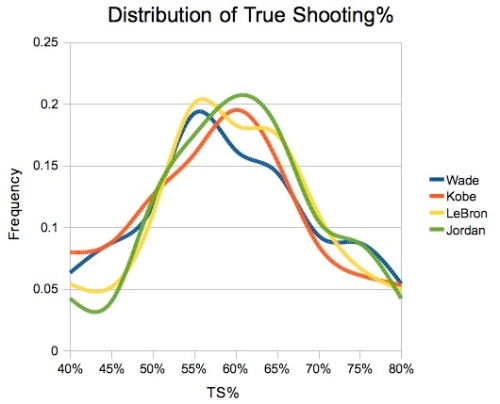
For those visually curious, and for the sake of consistency, here is the distribution of TS% for all games played in the respective time frames:

The frequency of games based on TS% for elite wings. Frequency (y-axis) is the percentage of games a player shot a given TS% (x-axis) for the following years: Jordan (87-98) Kobe (01-10) LeBron (06-10) and Wade (06-10).

Of course, none of this accounts for volume — in theory, players should shoot more when they shoot well, and shoot less when they shoot poorly. And that is the topic of the next post: high-volume scoring games.

Read Full Post »

As a follow up to this post, I’ve compiled the numbers from 82games clutch statistics in the postseason. They define “clutch” as the last five minutes of a 5-point game or closer. Unfortunately, the samples are much smaller and they don’t include 2010 playoff figures. The ten most notable players from that period:

Again, LeBron James comes out looking like Kal-El from Krypton. He and Carmelo Anthony are the only players to increase their shooting percentages down the stretch of close playoff games. Apparently, it’s impossible to shoot well in the playoffs. So much so that Kobe Bryant’s drop in eFG% of 5.6% over these six years is actually better than most of contemporaries.

LeBron somehow also ups his assists, which means from this group, only Steve Nash is setting the table as much at then end of close games. Nash bodes quite well, with per 36 minute averages of 22 points, 10 assists and 4 rebounds with an eFG% of 47% (second only to James). No surprises coming from perhaps the two best offensive players of the decade.

Garnett vs. Duncan

It’s worth revisiting how the two best “power forwards” of the era did here, since KG is so often criticized for shrinking down the stretch of games. In the regular season study, Garnett held his own again Timmy. Here, Duncan has a clear advantage:

Give Duncan some credit, although nothing overly spectacular. In Minnesota in 2004, Garnett averaged about 22 points per 36 minutes on 44% eFG% in these situations. He darn near disappeared in 2008 in Boston. In both cases, the rebounding and passing suffered. Garnett did shoot 80% from the line to Duncan’s 61% , but that’s about his only advantage. Although an extremely small sample — just 74 minutes — it’s a modicum of evidence supporting KG as a choker and validating Duncan’s endgame over Garnett’s.

EDIT: Thanks to drza’s contributions, it should be noted that if we include 2003, Garnett’s per36 numbers change to: 22.7 points 8.1 rebounds 0.9 assists 1.7 turnovers 55.7 TS% 48.6 eFG% in 84 minutes.

Read Full Post »

Henry Abbot had a fairly provocative and rich post at True Hoop the other day about Kobe Bryant’s clutch play. Yet more evidence that Kobe’s play drops off in the “clutch,” despite what many in the sport proclaim. Since there’s never been a clutch criterion that has revealed Bryant to be the best — here nor here, for instance — that’s not really a new claim.

What’s interesting is how different Bryant looks down the stretch of close games versus the final seconds of a game in which LA trails (Abbot’s study). In the former situation, Bryant’s one of the best offensive players in the NBA. Using ESPN’s criteria, Bryant is a shade above average, and his shooting percentage is well below many contemporaries. LA’s Offensive Rating in such clutch situations takes a precipitous drop down to just 82 points per 100 possessions, 27 fewer points per 100 possessions than their ORtg in Bryant’s career. That’s not as bad as it sounds — league average is 80 in that clutch study — but it’s still just 11th according to ESPN. In other words, LA is getting much worse down the stretch in these situations.

So does something change in Bryant and/or the Lakers? I think so.

Consider last year’s NBA Finals, in which LA was outscored by 11 points in the 4th quarter. In the first three quarters during that series, LA was +35. The correlation with Bryant’s drop in play is strong:

Kobe’s numbers in the last three NBA Finals have plummeted in the 4th quarter. Per 36 minutes, he averaged 23.6 points 3.2 rebounds and just 2.3 assists in those three Championship Series.

It’s the assist numbers that are particularly telling. Kobe had one assist in 82games game-winning shot study with over 60 true shooting attempts. That’s a stark change from the nearly 4 assists/36 he dished out during the last 5 minutes of close games since 2003. More shots — and difficult shots at that — combined with less passing make for a weaker offense.

So Bryant’s “closer” performances are actually quite good, but his tendency, and predictability, to shoot in lieu of making passes to wide open players is eroding his impact at the very end of games. Some recent notable examples:

  • In 2006, Nash takes a free run at him on this series winning attempt (an air ball).
  • In 2009 against Orlando, Bryant shoots here despite half his team standing uncovered
  • In 2010 against Phoenix, Bryant launches here with Fisher wide open in the corner (another air ball).

Clearly, Kobe’s decision-making down the stretch leaves a lot to be desired.

But people are clinging to the notion that Kobe is The Clutch King. Some of this is affirmation, as proponents point to all the game-winning shots and excellent numbers in the last 5 minutes.

Perhaps the most ironic piece of data in Abbot’s column: Kevin Garnett residing right next to Bryant. KG  is often labeled as a choker, particularly by Bryant backers. Bryant does what it takes to win. KG doesn’t. Or so they say. Yet he is 22-72 in such spots. They have nearly opposite reputations about “closing” and “clutch” play, yet nearly identical shooting percentages in such situations.

One of the more fascinating aspects of cognitive biases is that they often don’t go away when people are told about them. “Other people might do that, but I don’t,” is a common answer from people when told about human reasoning errors. Not  surprisingly, that leads to reactions like these after reading Abbot’s piece. But why?

And there are more reasons, of course. Matt Johnson over at A Susbtitute for War delves more into this pretty nicely, explaining why in-field experts like coaches can still be wrong when it comes to judging the frequency of repeated actions. The take-home here is, yet again, cognitive bias is at play when evaluating athletes. Stats aren’t a be-all-end-all, but they are a tool. And as Johnson says, we should use all the tools we have at our disposal, regardless of our expertise in a field.

Read Full Post »

People have been conflating team success with individual success in sports forever –81% in this decidedly unscientific poll. And it’s most frequently seen in basketball because one player can have such a large impact on a game. But even if it were once a decent correlative measure of a player back in the 50s and 60s, in a larger league with a larger talent pool, there are problems with it:

  • There are fewer and fewer opportunities for individuals to even play on a legitimate championship contender.
  • If they do, a dynasty can completely muck up the situation because the 2nd, 3rd, 4th…nth best player basically never wins. (See: Barkley, Malone, Ewing, Chamberlain, West, Robertson and so on.)
  • Even elite teams vary in strength

At the heart of individual player analysis is how much a player impacts the game and raises the probability his team will win. Again, that’s probabalistic, not dichotomous. Good players increase the chance of winning, just like good shooters increase the chance the shot goes in. It’s not black and white. No one shoots 100%.

Figuring out who is the best is a “bottom-up” process. We examine all the factors involved and conclude a result. But using championships is top-down. It starts with an individual winning and assigns credit from that result, all the while ignoring the massive confounds of teammates, competition, coaching and injuries.

There shouldn’t be some magical rankings boost given to a player because he was traded to a team with Ray Allen and Paul Pierce. You had to be living under a rock if you couldn’t see that pairing Kevin Garnett with good players wouldn’t instantly create a championship-level team. Yet KG was labeled as a choker and loser during his best years in Minnesota, despite strong evidence to the contrary.

In our minds, which are constantly subject to cognitive biases, winning maximizes strengths and losing exposes weaknesses. And we shine a light on both.

When a player develops a reputation, we remember it and actually look to affirm it in the future. Kobe misses more late-game shots than anyone, but he’s made a boatload too by virtue of taking so many, so people remember the ones he made. And they just ignore the ones he misses. Skip Bayless still seems to be under the impression that LeBron James isn’t good at the end of the games. Probably because of one or two readily accessible memories from the past. Similarly, most people were shocked by these results.

The media sells stories. Winners and loser. Good and bad. Make a key play at the end of the game, and you’re the hero — nothing else matters. Mess up at the end of the game, you’re the goat, nothing else matters. (That’s goat, the animal not the acronym.)

In the big picture, I have no problem saying Player A might “add 15-20 wins” to his team, or even any team on average. That’s kind of the Rosetta Stone of player value estimations. But to look at the extremely small sample size of the playoffs, ignore matchups, injuries and other circumstance and use the single championship every year in player analysis is just so far removed from the relationship to how good a player is, it seems, quite literally, useless.

Read Full Post »

Older Posts »