Feeds:
Posts
Comments

Posts Tagged ‘Advanced Basketball Statistics’

I’m a big fan of On/Off data, which compares a team’s point differential with a player on the court versus when he’s off the court. I’ve referenced it frequently in the past and think it’s one of the more telling reflections of a player’s value to his team in the advanced stat family.

The nice part about On/Off is that it represents what actually happened. The problem with On/Off is it ignores the reasons why it happened. And sometimes, it creates a fuzzy picture because of it.

For example, let’s suppose Kobe Bryant plays the first 40 minutes of the a game and injures his ankle with the score tied at 80. LA wins the game 98-90. The Lakers were dead even when he was in the game, and +8 with him out of the game – Bryant’s on/off would be -8.

In this case, sample size is an issue. But that becomes less of a problem over the course of an entire season. The real concern is the normal variance involved in everyone else’s game. Practically speaking, it takes little outside the norm for Kobe to have played 40 brilliant minutes while his teammates missed a few open shots, and for the opponent to miss a few open shots down the stretch while Kobe’s teammates start hitting them.

The tendency is to look at a result like that and conclude that Kobe hurt his teammates’ shooting and when he left the game it helped their shooting. He very well may have by not creating good looks for them.

Then again, players hit unguarded 3-pointers about 38% of the time. Which means if the average shooter attempts five open 3-pointers, he will miss all five about 10% of the time, simply based on the probabilistic nature of shooting. A fact that has little to do with Kobe or any of the other players on the court.

In our hypothetical situation, all it takes is an 0-5 stretch from the opponent and a 3-5 stretch from LA to produce Kobe’s ugly -8 differential. The great college basketball statistician Ken Pomeroy ran some illuminating experiments on the natural variance in such numbers. His treatise is worth the read, but the gist of it is that his average player — by definition — produced a -57 on/off after 28 games (-5.7 per game) due to standard variance in a basketball game outside of that player’s control. Think about that.

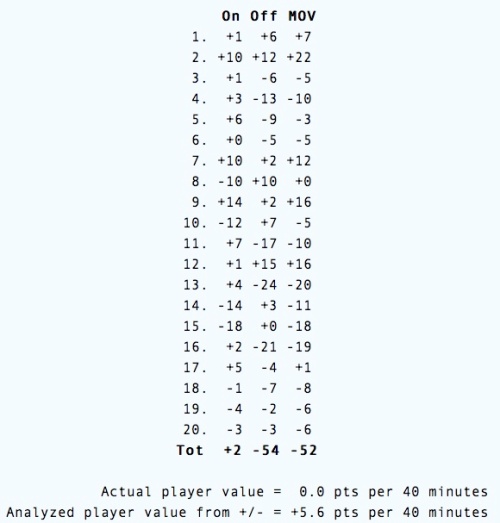
For fun, I just ran the same simulation and my average player posted a +5.6 rating of his college season:

Average Player Simulation

So in two simulations, the average player’s On/Off ranged from -5.7 to +5.6. One guy looks like an All-Star, the other like an NBDL player.

“The Team Fell Apart When Player X Was Injured”

This is a common argument for MVP candidates: Look at how the team fared when he missed a few games and conclude the difference is the actual value a player provides to his team. Only this line of thinking runs into the same problems we saw above with on/off data.

Let’s take Dirk Nowitzki and this year’s Dallas Mavericks. In 62 games with Dirk, Dallas has a +4.9 differential (7.8 standard deviation). In nine games without Dirk, a -5.9 differential (7.5 standard deviation).

Which means, with a basic calculation, we can say with 95% confidence that without Nowitzki, Dallas is somewhere between a -1.0 and -10.8 differential team. Not exactly definitive, but in all likelihood they are much worse without Dirk. OK…but we can’t definitively say how much worse they are.

In a small sample, we just can’t be extremely conclusive. In this case, nine games doesn’t tell us a whole lot. New Orleans started the season 8-0…they aren’t an 82-win team.

We can perform the same thought-experiment with Dirk’s nine games that we did with Kobe’s eight minutes to display how unstable these results are. Let’s say Dallas makes three more open 3’s against Cleveland and the Cavs miss three open 3’s. What would happen to the differential numbers?

  1. That alone would lower the point differential two points per game.
  2. Our 95% confidence interval now becomes -12.1 points to +4.4 points.

That’s from adjusting just six open shots in a nine game sample.

Jason Terry — a player who benefits from playing with Dirk Nowitzki historically — had games of 3-16, 3-15 and 3-14 shooting without Dirk. He shot 39% from the floor in the nine games. By all possible accounts, Terry is better than a 39% shooter without Nowitzki. He shot 26% from 3 in those games. Let’s use his Atlanta averages instead, from when he was younger and probably not as skilled as a shooter: How would that change the way Dallas looks sans-Dirk?

Well, suddenly Terry alone provides an extra 1.7 points per game with his (still) subpar shooting. The team differential is down to -2.2 with a 95% confidence interval of -10.4 to +6.1. Just by gingerly tweaking a variable or two, the picture grows hazier and hazier.

Making Sense of it All

So, what can we say using On/Off data? It’s likely Dallas is a good deal better with Dirk Nowitzki. But, hopefully, we knew that already.

To definitely point to a small sample and say, “well this is how Dallas actually played without Dirk, so that’s his value for this year” ignores normally fluctuating variables — like Jason Terry or an open Cleveland shooter — that have little to do with Dirk Nowitzki’s value. So while such data reinforces how valuable Dirk is, we can’t say that’s how valuable he is.

We can’t ignore randomness and basic variance as part of the story.
Read Full Post »

In the last post, we looked at the leaders in Expected Value (EV) on the defensive side of the ball for the 2010 playoffs. Not surprisingly, Dwight Howard was the winner there. Now let’s look at the offensive leaders in EV from the 2010 playoffs. There are three notable additions to the classic box score involved in that calculation:

“Help Needed” includes all of the points scored that were created by a teammate. I will have a post about it in the near future, but for now, think of Kobe Bryant driving down the lane and drawing hordes of defenders (an OC), setting up Andrew Bynum for an open dunk. In that case, Bynum’s dunk loses some value because it was created by another teammate. More on this in the future, though.

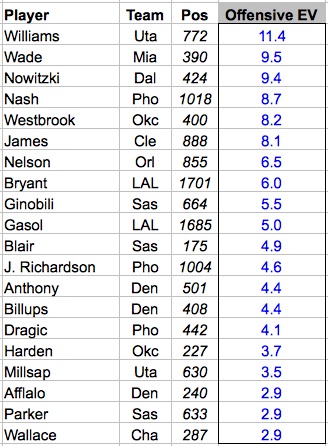
Here are the leaders in offensive EV from the 2010 playoffs, minimum 300 possessions played. All EV values are relative to league averge:

Offensive EV Leaders, 2010 Playoffs

As always, with playoff data, it’s important to remember particular matchups. Last year, Deron Williams dissected a soft Denver defense and then he made Derek Fisher look like an AARP member. Utah actually boasted the second best Offensive Rating in the playoffs — 114 pts per 100 possessions — but the defense let them down mightily. Here is the complete list of leaders in Offensive EV from the 2010 playoffs, minimum 300 possessions played.

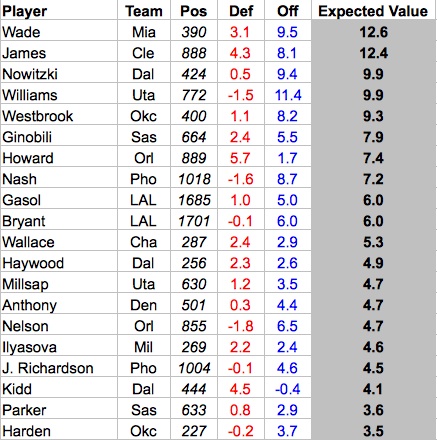
Finally, we can combine the defensive and offensive components and view the overall Expected Value leaders from the 2010 playoffs:

2010 Playoffs, min 150 possessions; Def=Defensive EV; Off=Offensive EV

By just about any measure, Dwyane Wade had a fantastic series against Boston’s vaunted defense. LeBron James’ second round against Boston wasn’t quite as good (8.5 EV), but he tortured Chicago in the opening series. Of the three superheroes, Kobe had it the worst of against Boston, posting a 3.4 EV in the Finals.

For reference, the top series performances by EV from the 2010 playoffs (EV in parentheses):

  1. James vs. Chi (16.2)
  2. Gasol vs. Uta (12.8)
  3. Howard vs. Atl (12.5)
  4. Nelson vs. Cha (12.5)
  5. Wade vs.Bos (11.8)
  6. Bryant vs. Pho (11.8)
  7. Nash vs. SAS (10.8)
  8. D Will vs. Den (10.2)
  9. Dirk vs. SAS (9.3)
  10. James vs. Bos (8.5)

Paul Gasol had the highest EV of the 2010 NBA Finals (5.0). Here is the complete list of EV leaders from the 2010 playoffs, minimum 150 possessions played.

Read Full Post »

Thanks to the recent statistical movement in major sports, basketball now has its share of “advanced” metrics to dazzle the eye and confuse the mind. All the new acronyms can be a little overwhelming at times: PER. WS. APM. TNT. OK, so the last one’s a TV network, but there are enough formulae that we need genius George Costanza to explain things:

Player Efficiency Rating (PER)

PER is a decent all-encompassing stat for summarizing basic box score data. But it has issues. The major failures of PER can be read about here, with the big flaw explained nicely:

Given these values, with a bit of math we can show that a player will break even on his two point field goal attempts if he hits on 30.4% of these shots. On three pointers the break-even point is 21.4%. If a player exceeds these thresholds, and virtually every NBA played does so with respect to two-point shots, the more he shoots the higher his value in PERs. So a player can be an inefficient scorer and simply inflate his value by taking a large number of shots.

Which means that volume shooting is rewarded by that metric as opposed to volume scoring. 11-30 shooting (37%) scores better than 5-12 shooting (42%). Yet at low percentages, the more attempts there are the worse the outcome is for overall offensive efficiency. Sorry, but I don’t find too much “advanced” information in a stat like that.

Wins Produced (WP)

The other advanced stat that I rarely ever use. There is a good detailed discussion of Wins Produced here.

The biggest issue with the stat is how it treats scoring and rebounding, which is how it was possible to predict 57-wins for the Warriors this year after summer transactions, while simultaneously identifying shooting guard as their weakest position. Monta Ellis, the team’s leading scorer and ostensibly its best player, happens to play SG.

With WP, a player who shoots under 50% from 2-point range hurts his score, regardless of how much he scores. Rebounding is given tremendous importance and there is no way to generate a negative rebounding score. Compare the following results based on the marginal values:

  • Player A: 17-30, 5 rebounds
  • Player B: 3-3, 15 rebounds

Player A earns 0.288 WP’s. Player B 0.576. Which means Ben Wallace is way better than Kobe Bryant. In other words, Wins Produced just assumes that scoring at a reasonably high baseline-rate will happen automatically. So the flaw with both WP and PER is the way they treat scoring, which happens to be the most important element of the game. Kind of a major flaw in a metric.

Plus-Minus Statistics

There is an entire family of +/- numbers that have been tracked this decade stemming from raw plus-minus.

  • Raw +/- is borrowed from hockey, and measures the team’s net result with a player on the court. When player A is in the game, if his team is 10 points better than the opponent, Player A’s +/- is +10.
  • On/Off looks at what happens when Player A leaves the game as well. If Player is +10 for the half of the game he plays, and in the other half his team is +10 without him, his on/off is 0. In theory, he didn’t affect team play much.
  • Adjusted Plus-Minus (APM) attempts to correct for teammate and opponent quality when a player is on the court.

Raw +/- has its obvious issues, some fleshed out in this New York Times article. Namely, team quality is the primary force behind the stat. Derek Fisher has an enormous +/- figure, but that probably has something to do with being on the floor with Kobe Bryant and Pau Gasol. It’s hard to find too much value in raw PM, particularly over short periods.

On/Off corrects much of that issue by looking at how a player performs relative to his own team. It’s an incredibly good stat for measuring situational value, assuming adequate sample sizes APM models also have some theoretical value, although not without issues.

There are three important things to be mindful of when comparing on/off and APM:

  1. The worse a team is, the easier it is to have a large number
  2. Noise
  3. The problem of Multicollinearity

First, when Kevin Garnett used to leave the game for the Minnesota Timberwolves, they’d fall apart. In a nutshell, Garnett’s impact measured in on/off and APM was enormous in Minnesota because it’s a lot easier to improve a 20-win team than a 60-win team. When Michael Jordan subbed off the court for the Dream Team, they probably didn’t miss a beat.

Second, there is an incredible amount of noise in plus-minus figures. A 10-0 run here, an injury there, some garbage time, whatever. In a small sample — something that plagues the plus-minus family — these make a big difference. Ken Pomeroy ran an interesting simulation to show how profound this effect can be in small samples.

Third, multicollinearity is a statistical phenomenon that, in this context, means the same players are constantly playing together. For example, Odom and Bryant in LA or Varejao and LeBron in Cleveland. It becomes difficult for any plus-minus model to differentiate between two players if they always play together.

For further issues facing APM models, I suggest Joe Sill’s paper on Regularized APM (RAPM). I will not delve into RAPM models because even Genius Costanza would be bored by machine learning techniques.

Win Shares

The good news about Win Shares (WS) is that they require no Ph.D. and yet they aren’t bland (the full explanation is here). WS are the resident stat over at Basketball-Reference and based largely on Dean Oliver’s great work with the box score. Win Shares are an extension of the individual ORtg and DRtg stats based on Oliver’s work.

Win Shares use box scores values, compares them to league averages (like points per possession) and finally adjusts for possessions played. The number of win shares is not based on actual team win-loss record, but the formula is designed to estimate contributions to a win based on these numbers, and the resulting shares approximates win-loss record quite well.

So, how in the world do we interpret Win Shares? First, similar to PER, they are limited by using only traditional box score metrics. However, unlike PER, I’ve yet to find a glaring flaw in WS. PER will break down if there aren’t enough shots to go around, which happens on a balanced team like the 2008 Celtics. Which result passes the sniff test?

Player PER Rank WS per48 Rank
K. Garnett 25.6 5th .265 2nd
P. Pierce 19.6 30th .207 10th
R. Allen 16.4 81st .177 21st

It’s fairly obvious that Win Shares is doing a pretty decent job ball-parking a player’s value using just the box. As such, I think it’s a really good summary/quick glance stat and much prefer it over PER. Of course, it will sometimes incorrectly assign credit based on certain roles because of failures in the box score. For instance, distributors like Steve Nash are thought to be slightly undervalued by Win Shares. Defensive players who don’t bode well in rebounding, blocks or steals will be undervalued by WS.

The other factor to be wary of when looking at the per 48 minute rate is just how much that player plays. Manu Ginobili is a great example of being able to do more well because he’s logging shorter periods on the court.

Read Full Post »