Feeds:
Posts
Comments

Archive for the ‘Analysis’ Category

Unless something drastic happens in the final weeks of the NBA season, Derrick Rose is going to win the MVP. He’s not a horrible choice — he’s in the top-5 on my ballot — but he’s probably not the correct choice. His supporters point to Chicago’s immense improvement from a year ago in the face of injuries to Joakim Noah and Carlos Boozer, who have missed a combined 54 games due to injury.

Only Rose isn’t responsible for a lot of that improvement.

It’s been well documented that under rookie coach Tom Thibodeau, Chicago has one of the top defenses in the NBA. The Bulls have improved their offensive rating 4.3 points, from 103.5 to 107.8, and their defensive rating 5.3 points, from 105.3 to 100.0. Here’s Rose’s individual improvement from last season to this:

Stats per 36 minutes

There’s no doubt he’s improved offensively and that has driven Chicago’s offensive improvement. Of course, the Bulls defensive improvement has been even more significant, and Rose plays a relatively small role in Chicago’s defensive dominance.

In 14 Bulls games I’ve tracked this year, the Bulls are boasting a 113.2 ORtg and 100.7 DRtg. The team breakdown is as follows:

Pos: Possesions played, OC: Opportunities Created, FD: Fouls Drawn

Rose’s huge EV numbers currently ranks 3rd in my database this year (although his outperforming his season averages on offense in this sample). He’s certifiably playing like a monster. His offensive load of over 54% — tops in the league — is indicative of just how much he does for Chicago on that end. He’s 2nd in Opportunities Created and 14th in assists per game, so it’s not just a shooting festival. Let’s give Rose a lot of offensive credit, but keep in mind that he’s not quite Steve Nashing* a weak offensive team, he’s Allen Iversoning* a weak offensive team. (Yes, players can be verbs too.)

*Nashing – to quarterback an otherwise weak offense to a top offense in the league. Also a superior version of “Iversoning,” which is carrying a weak offense to respectability.

Rose is a good defender too, but he’s not largely responsible for his team’s performance on that side of the ball: Chicago’s defense with Rose on the court is 101.8. Without Rose, it’s 93.1. From the 14 games I’ve tracked, Rose has the second lowest defensive usage on the team. Not surprisingly, Chicago’s defense is powered by players like Noah, Asik, Deng and Ronnie Brewer. Just from their defense, Chicago is getting about 19 or 20 wins above .500. The offense is dead average.

(It’s also impossible to ignore the value of COY Thibs. It’s rare we can clearly point to a coach lifting a team a few SRS points, and Thibs does that with his defensive schemes. Their rotations are ridiculously tight and they are as good in that department as the historical 2008 Celtics D.)

And lost in the Bulls shuffle is the all-star level play of Luol Deng. He’s defending incredibly well, and having his best offensive season since 2007. Even Deng’s three most frequent lineups without Rose have done well.

Not surprisingly, Chicago doesn’t have a large overall point differential with and without Rose (+1.2 with him). In 826 minutes, the Bulls are a staggering +7.3 without Derrick Rose. That’s not to say he isn’t great — he is — but starting with Chicago’s impressive record and distributing credit to Rose from there is giving him equal-part credit for their team defense, and that’s just wrong.

Rose is buoying the offense from below average to average, which shouldn’t be ignored. That’s precisely the reason he is a viable MVP candidate. But for people to think Rose is the reason for a 20-win jump like we’re seeing with Chicago is a gross misapplication of credit.

Read Full Post »

I’m a big fan of On/Off data, which compares a team’s point differential with a player on the court versus when he’s off the court. I’ve referenced it frequently in the past and think it’s one of the more telling reflections of a player’s value to his team in the advanced stat family.

The nice part about On/Off is that it represents what actually happened. The problem with On/Off is it ignores the reasons why it happened. And sometimes, it creates a fuzzy picture because of it.

For example, let’s suppose Kobe Bryant plays the first 40 minutes of the a game and injures his ankle with the score tied at 80. LA wins the game 98-90. The Lakers were dead even when he was in the game, and +8 with him out of the game – Bryant’s on/off would be -8.

In this case, sample size is an issue. But that becomes less of a problem over the course of an entire season. The real concern is the normal variance involved in everyone else’s game. Practically speaking, it takes little outside the norm for Kobe to have played 40 brilliant minutes while his teammates missed a few open shots, and for the opponent to miss a few open shots down the stretch while Kobe’s teammates start hitting them.

The tendency is to look at a result like that and conclude that Kobe hurt his teammates’ shooting and when he left the game it helped their shooting. He very well may have by not creating good looks for them.

Then again, players hit unguarded 3-pointers about 38% of the time. Which means if the average shooter attempts five open 3-pointers, he will miss all five about 10% of the time, simply based on the probabilistic nature of shooting. A fact that has little to do with Kobe or any of the other players on the court.

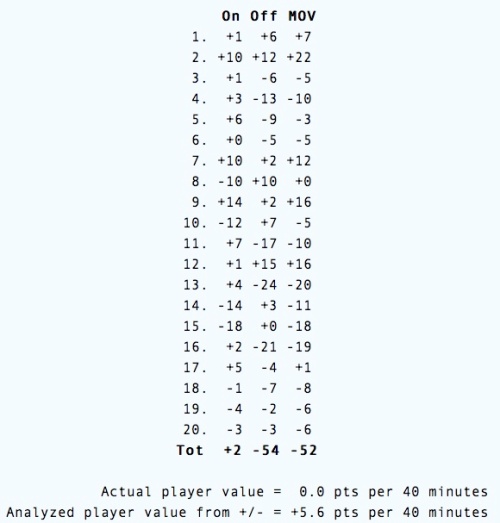
In our hypothetical situation, all it takes is an 0-5 stretch from the opponent and a 3-5 stretch from LA to produce Kobe’s ugly -8 differential. The great college basketball statistician Ken Pomeroy ran some illuminating experiments on the natural variance in such numbers. His treatise is worth the read, but the gist of it is that his average player — by definition — produced a -57 on/off after 28 games (-5.7 per game) due to standard variance in a basketball game outside of that player’s control. Think about that.

For fun, I just ran the same simulation and my average player posted a +5.6 rating of his college season:

Average Player Simulation

So in two simulations, the average player’s On/Off ranged from -5.7 to +5.6. One guy looks like an All-Star, the other like an NBDL player.

“The Team Fell Apart When Player X Was Injured”

This is a common argument for MVP candidates: Look at how the team fared when he missed a few games and conclude the difference is the actual value a player provides to his team. Only this line of thinking runs into the same problems we saw above with on/off data.

Let’s take Dirk Nowitzki and this year’s Dallas Mavericks. In 62 games with Dirk, Dallas has a +4.9 differential (7.8 standard deviation). In nine games without Dirk, a -5.9 differential (7.5 standard deviation).

Which means, with a basic calculation, we can say with 95% confidence that without Nowitzki, Dallas is somewhere between a -1.0 and -10.8 differential team. Not exactly definitive, but in all likelihood they are much worse without Dirk. OK…but we can’t definitively say how much worse they are.

In a small sample, we just can’t be extremely conclusive. In this case, nine games doesn’t tell us a whole lot. New Orleans started the season 8-0…they aren’t an 82-win team.

We can perform the same thought-experiment with Dirk’s nine games that we did with Kobe’s eight minutes to display how unstable these results are. Let’s say Dallas makes three more open 3’s against Cleveland and the Cavs miss three open 3’s. What would happen to the differential numbers?

  1. That alone would lower the point differential two points per game.
  2. Our 95% confidence interval now becomes -12.1 points to +4.4 points.

That’s from adjusting just six open shots in a nine game sample.

Jason Terry — a player who benefits from playing with Dirk Nowitzki historically — had games of 3-16, 3-15 and 3-14 shooting without Dirk. He shot 39% from the floor in the nine games. By all possible accounts, Terry is better than a 39% shooter without Nowitzki. He shot 26% from 3 in those games. Let’s use his Atlanta averages instead, from when he was younger and probably not as skilled as a shooter: How would that change the way Dallas looks sans-Dirk?

Well, suddenly Terry alone provides an extra 1.7 points per game with his (still) subpar shooting. The team differential is down to -2.2 with a 95% confidence interval of -10.4 to +6.1. Just by gingerly tweaking a variable or two, the picture grows hazier and hazier.

Making Sense of it All

So, what can we say using On/Off data? It’s likely Dallas is a good deal better with Dirk Nowitzki. But, hopefully, we knew that already.

To definitely point to a small sample and say, “well this is how Dallas actually played without Dirk, so that’s his value for this year” ignores normally fluctuating variables — like Jason Terry or an open Cleveland shooter — that have little to do with Dirk Nowitzki’s value. So while such data reinforces how valuable Dirk is, we can’t say that’s how valuable he is.

We can’t ignore randomness and basic variance as part of the story.

Read Full Post »

When the playoffs roll around (April 16, 2011) NBA teams typically shorten their rotations and bank on core units to play heavy minutes. I thought it would be worth examining the top 5-man units in the league this year, since (in theory) they will be logging more minutes in the postseason than they have throughout the year.

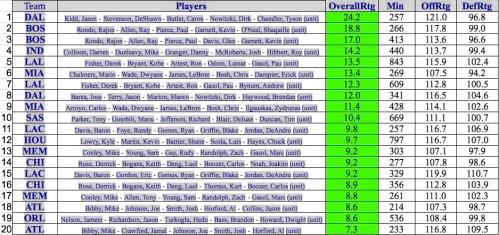
From Basketball Value, here are the top 5-man units in the league this year with a minimum of 200 minutes played (OverallRtg is the net difference per 100 possessions, or Offensive Rating minus Defensive Rating):

From basketballvalue.com; Numbers through March 23, 2011

So, in a relatively small sample (257 minutes) Dallas boasts the league’s best – err, wait a second. Caron Butler is part of that league-best unit for the Mavs, and unofficially, he is out for the season. So that lineup has no relevance going into the postseason. Which makes the best lineup the Boston Celtics starting five with Shaquille O’Neal at center…only Shaq has been out with a mysterious achilles injury since February 2.

After all the trades and injuries, that list deserves some housekeeping. The above rankings also include multiple lineups from the same team, so let’s only look at each team’s top 5-man group so we can rank teams by their best lineup.

Here is what that new list looks like, filtering for lineups (1) that still exist and (2) played a minimum of 200 minutes:

From basketballvalue.com; Numbers through March 23, 2011

Some notable new lineups are missing after the active trading spree this year:

Upon seeing Indiana’s place on that list, one’s first reaction might be shock and an undesirable itch to refresh the browser and make sure it’s parsing correctly. Thanks to the wizardry of basketballvalue, we can see the teams this Pacers group has done damage against; There’s no cause for panic.

The Indiana unit has outscored opponents by 125 points, with 54% of that differential amassed in games against nine sub-.500 teams — Sacramento, Cleveland, Washington, Toronto, New Jersey, Milwaukee, Minnesota, Charlotte and Detroit — with a combined win percentage of .299. Reassuringly, it’s just Fool’s Gold.

Is This a Good Historical Predictor?

A quick cursory glance using the 20-20 vision of hindsight shows:

In 2010, the top lineups by this measure were:

  1. Dallas (18.8)
  2. Phoenix (16.6)
  3. Orlando (16.4)
  4. Portland (16.2)
  5. Milwaukee (14.3)
  6. Boston/LA Lakers (13.3)

Portland can be excused because of Brandon Roy’s injury. Dallas lost to San Antonio (9th last year), and the Suns surprised some people by pushing the Lakers to the brink for the WCF title. Boston, sporting the league’s 10th best SRS, knocked off Cleveland (12th last year). Milwaukee is a notable outlier. Then again, Utah was 3rd in SRS and had the 19th-ranked team by lineup – the Jazz were swept by LA in the second round.

In 2009, the top lineups were:

  1. Orlando (23.8)
  2. Cleveland (19.5)
  3. Portland (18.5)
  4. LA Lakers (18.1)
  5. Dallas (11.4)
  6. Boston (11.1)

Orlando made a “surprising” run to the Finals. Portland lost to Houston (8th), although Nic Batum only played 63 minutes in the series and he was part of their token lineup. Boston was missing Kevin Garnett. And the major outlier was Denver (19th), who knocked off Dallas in the second round. Again, Utah fared well in SRS (8th) but finished just 18th in 5-man unit rankings. The Jazz lost in five games to LA.

It looks like there is good predictive value — especially when compared to SRS — in looking at top 5-man units. Which means the Bulls might have to wait for a 7th championship banner. Food for thought with the playoffs on the horizon.

Read Full Post »

In the last post, we looked at the leaders in Expected Value (EV) on the defensive side of the ball for the 2010 playoffs. Not surprisingly, Dwight Howard was the winner there. Now let’s look at the offensive leaders in EV from the 2010 playoffs. There are three notable additions to the classic box score involved in that calculation:

“Help Needed” includes all of the points scored that were created by a teammate. I will have a post about it in the near future, but for now, think of Kobe Bryant driving down the lane and drawing hordes of defenders (an OC), setting up Andrew Bynum for an open dunk. In that case, Bynum’s dunk loses some value because it was created by another teammate. More on this in the future, though.

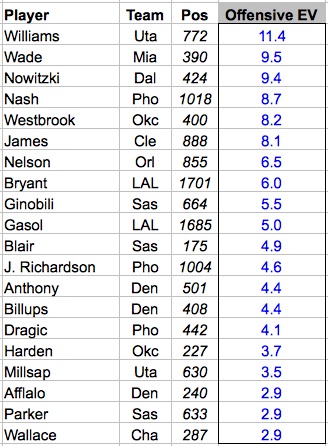
Here are the leaders in offensive EV from the 2010 playoffs, minimum 300 possessions played. All EV values are relative to league averge:

Offensive EV Leaders, 2010 Playoffs

As always, with playoff data, it’s important to remember particular matchups. Last year, Deron Williams dissected a soft Denver defense and then he made Derek Fisher look like an AARP member. Utah actually boasted the second best Offensive Rating in the playoffs — 114 pts per 100 possessions — but the defense let them down mightily. Here is the complete list of leaders in Offensive EV from the 2010 playoffs, minimum 300 possessions played.

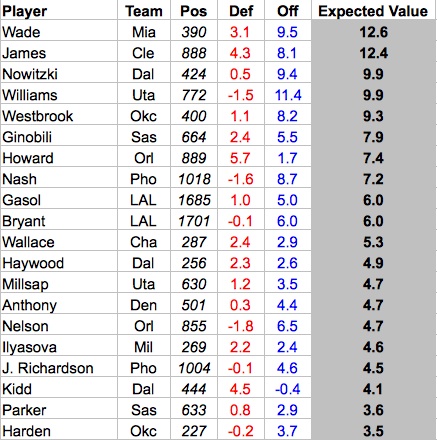
Finally, we can combine the defensive and offensive components and view the overall Expected Value leaders from the 2010 playoffs:

2010 Playoffs, min 150 possessions; Def=Defensive EV; Off=Offensive EV

By just about any measure, Dwyane Wade had a fantastic series against Boston’s vaunted defense. LeBron James’ second round against Boston wasn’t quite as good (8.5 EV), but he tortured Chicago in the opening series. Of the three superheroes, Kobe had it the worst of against Boston, posting a 3.4 EV in the Finals.

For reference, the top series performances by EV from the 2010 playoffs (EV in parentheses):

  1. James vs. Chi (16.2)
  2. Gasol vs. Uta (12.8)
  3. Howard vs. Atl (12.5)
  4. Nelson vs. Cha (12.5)
  5. Wade vs.Bos (11.8)
  6. Bryant vs. Pho (11.8)
  7. Nash vs. SAS (10.8)
  8. D Will vs. Den (10.2)
  9. Dirk vs. SAS (9.3)
  10. James vs. Bos (8.5)

Paul Gasol had the highest EV of the 2010 NBA Finals (5.0). Here is the complete list of EV leaders from the 2010 playoffs, minimum 150 possessions played.

Read Full Post »

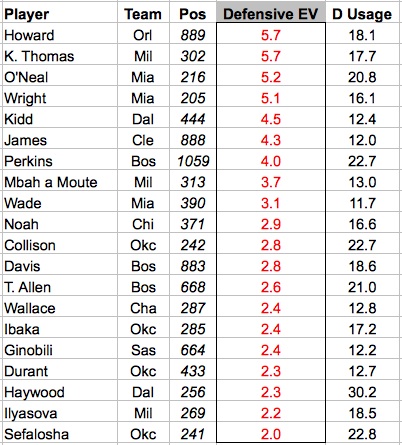
If you missed the last post, it was an overview of Expected Value (EV). And while that approach is not a novel concept — check out this similar method — from what I gather, incorporating a large defensive component is. Most of the defensive numbers used are from my stat-tracking. As a refresher, the defensive component of EV includes:

So which individual players fare the best in this metric? Below are the top defensive players in EV from the 2010 playoffs, with defensive usage included as a reference for the size of a player’s role (minimum 30 defensive plays “used”):

2010 Playoffs; Minimum 30 defensive possessions used

Dwight Howard, not surprisingly, had the best playoffs on the defensive end according to this. It’s good to be cautious of how small-sampled the playoffs are, given that one or two games against a hot or cold shooting opponent could skew these numbers. Then again, half the all-defensive team is represented on the list above, and that doesn’t include reputable defenders like Joakim Noah, Luc Richard Mbah a Moute and Tony Allen.

Because the playoffs are not only small sampled in games, but in opponents, it’s always important to consider matchups. Which makes Allen’s performance — mostly versus Dwyane Wade, LeBron James and Kobe Bryant — that much more impressive.

For those wondering about Kevin Garnett and Tim Duncan, they both just missed the cut. Garnett, to me, emphasizes the single greatest challenge in measuring individual defense causally: his greatest strength is probably communicating where to be and what is coming at all times to those around him. Now that’s difficult to quantify.

Finally, here is the complete list of defensive EV from the 2010 playoffs for all qualifying players (min 30 defensive possessions “used”).

Author’s Note: All EV values are relative to league average.

Read Full Post »

In a post last week debunking the nuclear overreaction to Miami’s late-game failures, I alluded to the Heat’s lack of depth and size. Which led me to thinking, just how little is Miami — still 43-21 and the boasting the best schedule-adjusted differential in the league — receiving from its non-stars?

According to broadcaster Eric Reid, the Heat’s bench has accrued 22% of the team’s points this year; Dead last in the NBA. This wouldn’t be too big of an issue if the Heat’s starters were a well-oiled, balanced machine.

They aren’t.

Using the Simple Rating at 82games (a combination of on/off and production), the Heat have two superstars, a good third player, and only two players hovering around even (James Jones and Zydrunus Ilgauskas). The elite teams giving them trouble have the following distribution (total quality players in parentheses):

  • Chicago (9 quality players): 1 good player, 3 positives, 5 players around even
  • LA Lakers (7): 4 good players, 2 positives, 1 player around even
  • Boston (6): 1 elite players, 2 good players, 1 positive, 1 player around even
  • Dallas (6): 1 elite player, 1 good player, 2 positives, 2 players around even
  • Orlando (6): 1 elite player, 1 good player, 1 positive player, 3 around even
  • San Antonio (6): 1 elite player, 1 good player, 3 positive players, 1 around even
  • Oklahoma City (6): 1 good player, 2 positive, 3 around even

Miami may have the best duo in the league, but they are somewhat redundant in role (neither can guard centers, neither can shoot 3’s too well). Another quality player, especially on the interior, would do wonders for Miami. Dean Oliver thinks less dribbling from the stars might also help help create better shots and offensive balance.

***

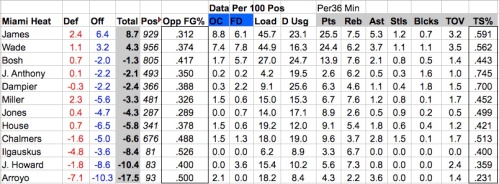
In my own stat-tracking, I’ve charted 13 Heat games this year. They are 2-11 in those games, with an Offensive Rating of 99.1 and Defensive Rating of 109.4. Their combined opponent’s win percentage in those games is .614, so it’s a decent smattering of Miami losing and losing to elite teams. In those games, the team breakdown is as follows:

Pos: Possesions played, OC: Opportunities Created, FD: Fouls Drawn

Here we can see the nosedive that Miami’s role players have taken in these games. It’s hard to say which is worse for them, the point guard position or the center position. In all likelihood, Miami doesn’t have a point or a center that would play relevant minutes on any other contender in the league. Not a one. Joel Anthony and Erick Dampier have at least been around average on defense.

But the shooting in these games from the rest of the supporting cast borders on offensive: Mario Chalmers is the only other player over 50% True Shooting, and still clocking in at about 2% lower than league average. Mike Miller has been dreadful in these games. Excluding Wade and James, Miami is shooting 31% from downtown and making just 3.7 3-pointers per game in this sample (season averages 33.7% and 6.7, respectively).

Chris Bosh’s performance also drastically falls off (even if we exclude the 1-18 disaster). They have almost zero production from their bench, with no one outside of the all-stars averaging north of 10 points per 36 minutes. To put that in perspective, nearly eighty percent of the NBA scores at least 10 points per 36 minutes.

Unless Miami can get something — average outside shooting? — from the role players and a better Chris Bosh, it’s not going far in the playoffs, regardless of what Wade and James do.

Read Full Post »

82games just updated its numbers for the 2011 season, and of particular interest is Miami’s performance in clutch situations (5 point game or closer in the final 5 minutes). As far as I know, no one publishes team stats for these situations.

In lieu of that, we can ballpark a team’s clutch performance by looking at the team leaders in clutch minutes. Included is the percentage of clutch minutes that player has played for his team, and the player’s overall plus-minus for the season for comparison.

From 82games.com through 3/05/11

So it’s not like Miami is crumbling or lost down the stretch of these games. They are actually about 15 points better than opponents over the course of a game using this criteria. More surprisingly, Miami’s offense with James on the court (95% of its clutch minutes) boasts an Offensive Rating of over 120. By comparison, the Lakers ORtg with Bryant is just under 109. Boston’s with Pierce is 108.5. Chicago’s with Rose 108.

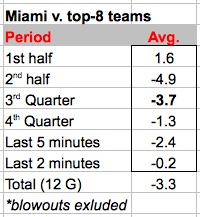
Hmm. Maybe Miami’s clutch problem is against elite teams only? The Heat have played 12 competitive games against the eight best teams this year (with a 2-10 record in those games). In the final two minutes of those games, Miami’s average point differential is -0.2. Basically dead even.

In the final five minutes of these games their average point differential is -2.4. That’s -29 over 60 minutes of play; Finally some evidence of close-game failures. But even 79% of that difference comes from two games against Orlando in which the Magic bombarded Miami down the stretch (in the November 24 and February 3 games). Here’s the Heat’s complete breakdown against the top-8 by section of the game:

It’s fair to say that Miami’s struggles down the stretch are overblown. With the exception of one incredibly specific, small-sampled criteria: The final 10 seconds of games when trailing by three or less. According to an ESPN graphic posted after the game, Miami is just 1-18 shooting in such scenarios.

Is it plausible that the Heat will continue to shoot 6% in these situations for the remainder of the season and the playoffs? Unlikely. Right now, they’re on the (extreme) wrong side of variance in a small sample size (18 shots).

That doesn’t mean there aren’t legitimate problems in South Beach. Only, they have a lot less to do with close games and a lot more to do with size and depth. Which, of course, were the original problems in the first place when they cleaned house in the offseason.

The Heatles aren’t losing these games in the final seconds. They are losing them in the 3rd quarter (and into parts of the 4th). And there’s no reason to believe that isn’t a direct result of playing three on five most of the time.

Miami was thin enough heading into the season before Udonis Haslem’s injury. It has now logged over 1000 minutes at center from Juwan Howard and Erick Dampier. Combined age: 73. (Yes, they still play basketball.) Mike Miller has played 500 disappointing minutes returning from injury.

Miami’s biggest problem heading into the playoffs this year isn’t the end of close games – that issue has been greatly exaggerated, and it will improve with experience and, statistically, by default. The Heat’s biggest problem is the same one they’ve had all season: size and depth.

Read Full Post »

A poster on the realgm forums named Nonemus recently wondered how everyone’s favorite triumvirate of wings, Kobe Bryant, LeBron James and Dwyane Wade, have stacked up against elite teams in the playoffs. Some of the numbers are worth examining here, namely how these three have performed against defenses separated by quality. Are any of them bottom-feeders? Do they equally suffer against the best defensive teams? Has one played a disproportionately large amount of games against amazing defenses?

First, we need to define elite defenses. Since the rule changes in 2005, only 41 teams have posted a defensive rating of 104 or lower. Which means, on average, a 104 DRtg is about the 6th best defense in the league and roughly three points better than average. Certainly a fair cutoff point with which to work. Similarly, let’s call “solid” defensive opponents those with a DRtg between 104 and 107 (roughly better than average), and “bad” defenses having below average Defensive Ratings (lower than 107).

Using that distinction, it turns out Dwyane Wade has played the majority of his playoff games against elite defenses (68% of all games versus such teams). LeBron has played 42% against top defenses and Kobe 38%. Below are their statistics, per 36 minutes, broken down by defensive quality. (GmSc is their Game Score).

Fittingly, Bryant and James show improvement the easier the defensive foe. Wade, however, has some surprising results. His performance versus elite D and non-elite D isn’t too different. (Note, those six games against “solid” defenses are from the 2006 Finals against Dallas.) He quite clearly outperforms the other two against elite defensive teams, even ramping up his three-point % and assists.

LeBron’s history against elite defensive teams is a tale of two players. In his first 15 games against such opponents, James struggled mightily, to put it mildly. He was dreadful, posting a 45.9% TS percentage and averaging over four turnovers per 36 minutes. Hide the women and children.

Below are his splits — the first 15 games are against 2006 Detroit, 2007 San Antonio and the first four games against Boston in 2008:

So James has been a different player against top defenses since game 5 against Boston back in 08, scoring and shooting better than he has even against solid defenses and posting a monstrous Game Score that tops Wade’s or Bryant’s GmSc against even the weakest defenses. The lesson, as always, is that LeBron James has been really good for the last few years.

Here is how each player’s series looks visually, measured using Game Score. The x-axis is a team’s defensive rating and y-axis the players average GmSc for the series:

The coefficient of correlation between Game Score and Opponent Defensive rating is as follows for each player:

  1. LeBron .582
  2. Kobe .561
  3. Wade .409

Which implies that LeBron’s Game Score by series is the most heavily influenced by opposing defense and Wade’s is the least affected. That is, the more positive correlation suggests that as the defense is worse, the performance better. That bottom-feeding trend is the strongest in LeBron’s case, and can be seen above with all his data points in the upper right quadrant.

All of this begs the question: Is it better for performance to vary according to defensive strength, or better to remain consistent regardless of opponent quality? In his only two series against bad defensive teams, Wade shows no appreciable improvement. LeBron and Kobe feed off bad defenses, to a certain degree.

In the playoffs, teams can expect to encounter difficult defenses on the path to a title. Since the inception of the three-point line in 1980, only five teams with an SRS over 6 had a defensive rating over 107. And 58% of those 6+ SRS teams qualified as “elite,” with a DRtg of 104 or lower. Which means in this case, Dwyane Wade may provide a distinct advantage on the game’s biggest stage.

Here is a complete list of each players series against elite defenses in the playoffs since 2005.

Read Full Post »

The last NBA trade deadline of the current Collective Bargaining Agreement passed with a bang this week, as roughly 10% of the league changed teams (48 players in total).  Carmelo Anthony and Deron Williams were the two biggest names, but perhaps no trade meant more to the landscape of the 2011 postseason than Oklahoma City sending Jeff Green and Nenad Kristic to Boston for Kendrick Perkins and Nate Robinson.

I’ve spent the last year or so having the following arguments with people:

  1. Kendrick Perkins is more important to Boston than people realize; he’s one of the best defensive centers in the league.
  2. Jeff Green’s inability to be a legit third cog is the reason the Thunder aren’t elite. He’s undersized at power forward, doesn’t rebound particularly well and doesn’t shoot well.

And the numbers agree.

After 1250 possessions tracked from last year’s playoffs and this season, Perkins grades out as one of the best defenders in the league. Opponents are shooting just 29.3% when he guards them, one of the best figures in the league. He makes a defensive error about half as often as the average player. Offensively, he is as advertised: a negative with little range and a borderline liability down the stretch.

My player rating — to be discussed in a future post — thinks this a huge win for Oklahoma City and a step back for Boston. Such an estimation is based on the following minutes distribution for each team:

BOSTON:

  • Rondo 38
  • Allen 36
  • Pierce 33
  • Garnett 33
  • Davis 29
  • Green 27
  • Kristic 22
  • West 18
  • Wafer 4

OKLAHOMA CITY:

  • Durant 39
  • Westbrook 35
  • Ibaka 30
  • Perkins 27
  • Collison 26
  • Harden 26
  • Sefolosha 25
  • Maynor 13
  • Robinson 12
  • Cook 7

Specifically, as long as the O’Neal’s remain out of the lineup, the metric predicts a point differential drop of just over three points per game (Deltone West’s return not included). Ouch. Conversely, it predicts an even greater improvement for Oklahoma City, although still leaves them slightly short of Boston as a team. Obviously, each team’s SRS will be something to follow closely over the final quarter of the season.

The Celtics have more question marks now besides the O’Neals. West is being reintegrated into the lineup, so it’s possible he might pick up some offensive slack. More germane, though, is that Jeff Green is expected to log healthy minutes at small forward, a more natural fit for him.

Green started five games at the 3 back in 2009, averaging 14.6 points, 5.0 rebounds 2.2 assists on 50.3% True Shooting in such games. According to 82games, he’s played 10% of his minutes this year at small forward, with terrible offensive results and excellent defensive ones. Green showed similar defensive strength and offensive ineptitude at small forward last year.

Most of our remaining information on Green is at power forward. And there, he hasn’t looked good.

His opponents have shot 43.6% from the field when Green is guarding them — slightly higher than league average. His other defensive figures are marginal, at best. Offensively, Green’s outside shooting has fallen off, down to 30% from 3-point land this season. He rarely earns trips to the free throw line and rarely creates opportunities for teammates.

Ostensibly, Danny Ainge claims the Celtics need to score more to win. It’s possible that green will be a good fit for Green, and that Rajon Rondo, Paul Pierce and Doc Rivers can help his offense improve.  Only, nothing about Green’s history suggests that he’s going to help too much on the offensive end.

A tip of the cap to Sam Presti for landing a physical defensive presence in exchange for a feeble one.*

*Perkins will be a free agent at season’s end, so the thinking is Boston wanted something in return instead of losing him to free agency. He also has an injury history that may make the move look good down the road.

Read Full Post »

When I was growing up, a “closer” was a term reserved for baseball pitchers. Specialists with strange facial hair who were only used when their teams protected narrow leads and needed three outs to finish the game.* Then a closer became someone with enough machismo to finish real estate deals. Kyra Sedgwick turned out to be The Closer. And finally, it devolved into a basketball term.

*I never understood the decision not to use closers when teams were behind by a run. Why opt for a lesser pitcher simply because a save opportunity wasn’t available?

In the NBA, a “closer” refers to star players who play well down the stretch of close games. Give them the ball, and they will guide a team to victory. Simplify the game and ride the best player to victory.

In other words, the best closers are the best offensive anchors at the end of tight games. So naturally, unless there is a drastic difference between normal performance and late-game performance, the best closers will be the best overall offensive players in the game.

Some people believe that clutch performance varies wildly in professional sports. That pro athletes are wired differently, some live for big moments and others shrink in them. And there is quality reasoning behind that thinking. So, when something like this starts rolling, it’s hard to stop its momentum:

It didn’t stop there. Mark Jackson kept calling Kobe Bryant the best closer during game coverage. Skip Bayless has echoed it. This informal 2009 poll of players agreed that Kobe was the King of Clutch.

Kobe’s shortcomings in such situations have been extensively documented. The meme floating around that he’s the de facto best closer/clutch player in the league is actually less erroneous than its evil twin, the Un-Clutch meme. That has been slapped on undeserving players like Karl Malone and Kevin Garnett before, and now it follows LeBron James.

Only LeBron James is plenty clutch. Actually, he’s the best closer in basketball. And it’s not even really close.

In the first batch of clutch numbers I crunched from 82 games, looking at the final 5 minutes of 5-point games or closer, LeBron practically lapped the field. In 477 minutes of closer duty from 2008 to 2010, LeBron’s Cavs were +27.2 per 36 minutes. That is mind-boggling, given that the best NBA teams in history are about +9 per 36 minutes. It’s even more superhuman when one considers how they’ve completely crumbled as a team without James.

He managed to score, rebound and distribute down the stretch of close games while shooting 10% better than league average in eFG%. Holy Superman, Batman! Frankly, he looks like the best player in NBA history based on his closer line.

The next set of numbers looked at playoff performances in such situations. Again, James showed the same pattern: his scoring, shooting and assist numbers spiked. Of the players examined in that post, only one other (Carmelo Anthony) improved his playoff shooting in the clutch, and only Steve Nash averaged more assists. Of course, LeBron scored at nearly double Nash’s rate.

It’s almost as if most of LeBron’s value is disproportionately unleashed at the end of close games. He is, in many ways, the ultimate closer.

Yet the indestructible meme following LeBron is that he’s not a closer.

Some argue that he’s too unselfish at the end of games. But he actually shot the ball more frequently than anyone from 2008-2010, including Kobe Bryant. He has attempted 69 attempts in the final 24 seconds of close games according to this ESPN study, which is about 10 per year. Again, more than anyone on the list.

Even his free throw shooting is refined when he’s closing. 81% on 187 free throw attempts from 2008-2010, up 6.3% from all other situations. He made 20 consecutive late-game free throws this year before missing one two weeks ago. The last time 82games ran “super clutch” numbers (final 2 minutes of a 3-point game), LeBron was in video-game land.

Last week, Kevin McHale opined on NBATV that Miami should have LeBron be a distrbutor down the stretch and let Wade be the team’s closer. Skip Bayless loves to slam his ESPN desk and note how Wade is a great closer and LBJ isn’t.*

I don’t know what it will take to kill those ideas. I suspect the way to destroy the Un-Clutch meme is to win a championship. Hopefully, In the meantime, this is a start.

*If pressed, here are my late-game offensive player rankings since 2003. Note Wade’s absence:

  1. LeBron James
  2. Steve Nash
  3. Kobe Bryant
  4. Manu Ginobili
  5. Chris Paul

Read Full Post »

Older Posts »