Feeds:
Posts
Comments

Posts Tagged ‘Stat-tracking’

Unless something drastic happens in the final weeks of the NBA season, Derrick Rose is going to win the MVP. He’s not a horrible choice — he’s in the top-5 on my ballot — but he’s probably not the correct choice. His supporters point to Chicago’s immense improvement from a year ago in the face of injuries to Joakim Noah and Carlos Boozer, who have missed a combined 54 games due to injury.

Only Rose isn’t responsible for a lot of that improvement.

It’s been well documented that under rookie coach Tom Thibodeau, Chicago has one of the top defenses in the NBA. The Bulls have improved their offensive rating 4.3 points, from 103.5 to 107.8, and their defensive rating 5.3 points, from 105.3 to 100.0. Here’s Rose’s individual improvement from last season to this:

Stats per 36 minutes

There’s no doubt he’s improved offensively and that has driven Chicago’s offensive improvement. Of course, the Bulls defensive improvement has been even more significant, and Rose plays a relatively small role in Chicago’s defensive dominance.

In 14 Bulls games I’ve tracked this year, the Bulls are boasting a 113.2 ORtg and 100.7 DRtg. The team breakdown is as follows:

Pos: Possesions played, OC: Opportunities Created, FD: Fouls Drawn

Rose’s huge EV numbers currently ranks 3rd in my database this year (although his outperforming his season averages on offense in this sample). He’s certifiably playing like a monster. His offensive load of over 54% — tops in the league — is indicative of just how much he does for Chicago on that end. He’s 2nd in Opportunities Created and 14th in assists per game, so it’s not just a shooting festival. Let’s give Rose a lot of offensive credit, but keep in mind that he’s not quite Steve Nashing* a weak offensive team, he’s Allen Iversoning* a weak offensive team. (Yes, players can be verbs too.)

*Nashing – to quarterback an otherwise weak offense to a top offense in the league. Also a superior version of “Iversoning,” which is carrying a weak offense to respectability.

Rose is a good defender too, but he’s not largely responsible for his team’s performance on that side of the ball: Chicago’s defense with Rose on the court is 101.8. Without Rose, it’s 93.1. From the 14 games I’ve tracked, Rose has the second lowest defensive usage on the team. Not surprisingly, Chicago’s defense is powered by players like Noah, Asik, Deng and Ronnie Brewer. Just from their defense, Chicago is getting about 19 or 20 wins above .500. The offense is dead average.

(It’s also impossible to ignore the value of COY Thibs. It’s rare we can clearly point to a coach lifting a team a few SRS points, and Thibs does that with his defensive schemes. Their rotations are ridiculously tight and they are as good in that department as the historical 2008 Celtics D.)

And lost in the Bulls shuffle is the all-star level play of Luol Deng. He’s defending incredibly well, and having his best offensive season since 2007. Even Deng’s three most frequent lineups without Rose have done well.

Not surprisingly, Chicago doesn’t have a large overall point differential with and without Rose (+1.2 with him). In 826 minutes, the Bulls are a staggering +7.3 without Derrick Rose. That’s not to say he isn’t great — he is — but starting with Chicago’s impressive record and distributing credit to Rose from there is giving him equal-part credit for their team defense, and that’s just wrong.

Rose is buoying the offense from below average to average, which shouldn’t be ignored. That’s precisely the reason he is a viable MVP candidate. But for people to think Rose is the reason for a 20-win jump like we’re seeing with Chicago is a gross misapplication of credit.

Read Full Post »

In the last post, we looked at the leaders in Expected Value (EV) on the defensive side of the ball for the 2010 playoffs. Not surprisingly, Dwight Howard was the winner there. Now let’s look at the offensive leaders in EV from the 2010 playoffs. There are three notable additions to the classic box score involved in that calculation:

“Help Needed” includes all of the points scored that were created by a teammate. I will have a post about it in the near future, but for now, think of Kobe Bryant driving down the lane and drawing hordes of defenders (an OC), setting up Andrew Bynum for an open dunk. In that case, Bynum’s dunk loses some value because it was created by another teammate. More on this in the future, though.

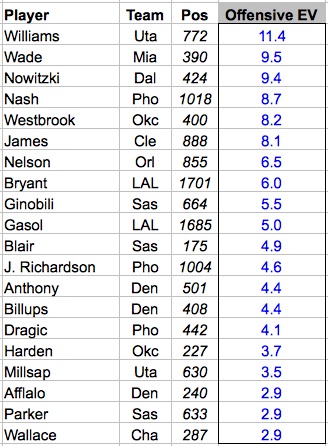
Here are the leaders in offensive EV from the 2010 playoffs, minimum 300 possessions played. All EV values are relative to league averge:

Offensive EV Leaders, 2010 Playoffs

As always, with playoff data, it’s important to remember particular matchups. Last year, Deron Williams dissected a soft Denver defense and then he made Derek Fisher look like an AARP member. Utah actually boasted the second best Offensive Rating in the playoffs — 114 pts per 100 possessions — but the defense let them down mightily. Here is the complete list of leaders in Offensive EV from the 2010 playoffs, minimum 300 possessions played.

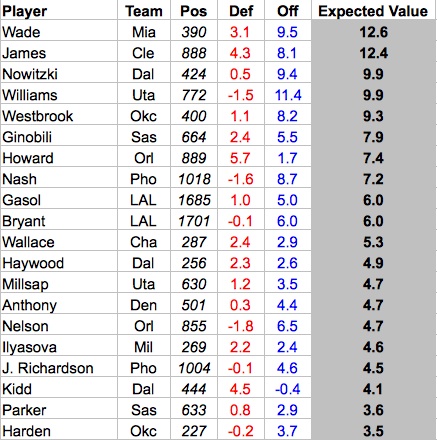
Finally, we can combine the defensive and offensive components and view the overall Expected Value leaders from the 2010 playoffs:

2010 Playoffs, min 150 possessions; Def=Defensive EV; Off=Offensive EV

By just about any measure, Dwyane Wade had a fantastic series against Boston’s vaunted defense. LeBron James’ second round against Boston wasn’t quite as good (8.5 EV), but he tortured Chicago in the opening series. Of the three superheroes, Kobe had it the worst of against Boston, posting a 3.4 EV in the Finals.

For reference, the top series performances by EV from the 2010 playoffs (EV in parentheses):

  1. James vs. Chi (16.2)
  2. Gasol vs. Uta (12.8)
  3. Howard vs. Atl (12.5)
  4. Nelson vs. Cha (12.5)
  5. Wade vs.Bos (11.8)
  6. Bryant vs. Pho (11.8)
  7. Nash vs. SAS (10.8)
  8. D Will vs. Den (10.2)
  9. Dirk vs. SAS (9.3)
  10. James vs. Bos (8.5)

Paul Gasol had the highest EV of the 2010 NBA Finals (5.0). Here is the complete list of EV leaders from the 2010 playoffs, minimum 150 possessions played.

Read Full Post »

If you missed the last post, it was an overview of Expected Value (EV). And while that approach is not a novel concept — check out this similar method — from what I gather, incorporating a large defensive component is. Most of the defensive numbers used are from my stat-tracking. As a refresher, the defensive component of EV includes:

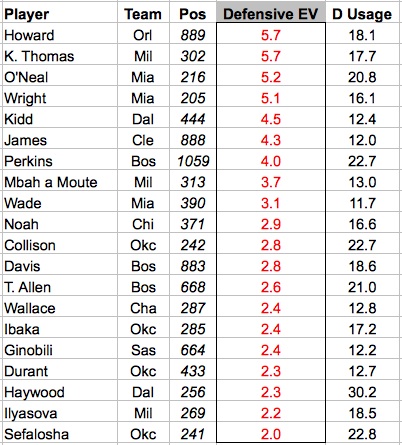
So which individual players fare the best in this metric? Below are the top defensive players in EV from the 2010 playoffs, with defensive usage included as a reference for the size of a player’s role (minimum 30 defensive plays “used”):

2010 Playoffs; Minimum 30 defensive possessions used

Dwight Howard, not surprisingly, had the best playoffs on the defensive end according to this. It’s good to be cautious of how small-sampled the playoffs are, given that one or two games against a hot or cold shooting opponent could skew these numbers. Then again, half the all-defensive team is represented on the list above, and that doesn’t include reputable defenders like Joakim Noah, Luc Richard Mbah a Moute and Tony Allen.

Because the playoffs are not only small sampled in games, but in opponents, it’s always important to consider matchups. Which makes Allen’s performance — mostly versus Dwyane Wade, LeBron James and Kobe Bryant — that much more impressive.

For those wondering about Kevin Garnett and Tim Duncan, they both just missed the cut. Garnett, to me, emphasizes the single greatest challenge in measuring individual defense causally: his greatest strength is probably communicating where to be and what is coming at all times to those around him. Now that’s difficult to quantify.

Finally, here is the complete list of defensive EV from the 2010 playoffs for all qualifying players (min 30 defensive possessions “used”).

Author’s Note: All EV values are relative to league average.

Read Full Post »

I’ve talked about “guarded situations” before, but never from the perspective of an individual defender. We can use a “guarding situation” as a quick and dirty operational definition for looking at FG% against individual defenders. To reiterate the definition of a guarded situation:

  • The defender is trying to defend an offensive player without being impeded by a screen or helping on defense
  • The defender is challenging an offensive player at the basket by “engaging” in guarding them
  • The defender is double-teaming in a manner that actually impacts the opponent’s shot

The first situation has a gray area when players are screened out and then “re-engage” in guarding them (or switch on screens and pick up a new man). I look at the defenders stance and spacing from the offensive player to determine if he’s re-engaged: If the defensive player hasn’t had time to establish that position as he otherwise would have, he hasn’t engaged the offensive player again. (For eg, scrambling and lunging at a shot attempt from 4 feet away after being screened isn’t “guarding,” it’s more akin to closing out on a jumper shot.)

The second situation is fairly straightforward — Dwight Howard isn’t engaged in “guarding” a player by leaping across the lane at the last second, after a shot is taken, trying to block it. That’s the equivalent of a closeout on a jump shot, and for these purposes ignored (unless the shot is literally blocked). But when he’s standing in the lane and picks up the attacker coming toward the rim, he is now guarding the offensive player.

The last situation is simply to clarify that an incoming double-team is not an engaged double-team. If Dwayne Wade runs at a post player to double, he isn’t actually guarding him until he gets there. Engaged double- teams count as half attempts for each defender.

From that definition, we can look at how players shoot against defenders. The average guarded shot in 164 team games tracked this year is 40.6%. In last year’s playoffs, it was 39.6%, mostly due to the number of games played by good guarding teams like Boston (35.6% against), Orlando (36.6% against) and Los Angeles (38.0% against).

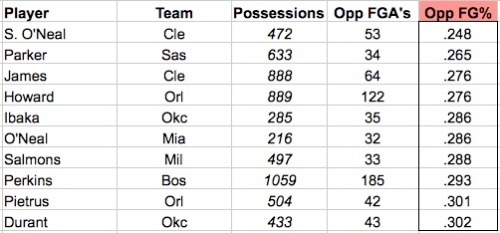
Here are the individual leaders from the 2010 playoffs in FG% against (min 30 FGA):

2010 Playoff Leaders FG% Against; Min 30 FGA's

There are some not-so-surprising names on that list. Players with good defensive reputations like LeBron James, Howard, Serge Ibaka and Kendrick Perkins. Although it’s always important to keep in mind that playoff samples are heavily influenced by the matchups from a series or two.

There are surprising names there too, perhaps most notably Tony Parker. After 26 FGA against this year, Parker’s opponents are shooting 50%. Ah, small sample sizes! Here are the leaders from games tracked in the regular season so far this year (min 30 FGA):

Min 30 FGA

Again, it might be surprising to see Jason Kidd’s name there, but he just missed the cut for the playoff leaders last year — 31.3% against. Even at his advanced age, he can still defend quite well, and I imagine his large frame and intelligent positioning make scoring on him more difficult than normal.

Another name that might stand out, other than Shannon Brown, is Derek Rose. I will have a post on Rose and the Bulls defense in the near future, but there is no doubt Rose’s athleticism has made him a really solid defender at the point guard position.

Included here is the complete list of qualifying players in FG% against from 2010 playoffs.

Read Full Post »

In 1974, the NBA started tracking steals. And apparently, they thought that was a sufficient measure of forcing turnovers on defense, because they haven’t added anything related in their box score since.

The easiest measure of forcing turnovers is to track offensive fouls drawn. Hoopdata provides charges taken, although nothing is listed for the 2011 season. In my stat-tracking, I note any offensive foul drawn, excluding the moving screen.

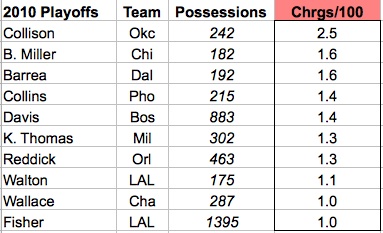
In last year’s playoffs, the average player drew 0.31 offensive fouls per 100 possessions. In tracking games this year, that number is 0.49/100 possessions (there was a lot of good offense in the 2010 postseason, despite the NBA Finals). Here are the leaders in “charge” rates — offensive fouls taken per 100 possessions — from last year’s playoffs:

Nick Collison was hitting the deck like a sailor in the Thunder’s six games against LA. Derek Fisher drew the most total charges, with 14. A familiar name for those who are abreast to charge-related statistics is Glen Davis, who was this year’s NBA leader at the last unofficial count I heard.

***

There are other ways to force turnovers on defense that don’t reach the box. There are two in particular that I track and both have to do with deflecting the ball in a manner not registered as a steal:

  1. Knocking the ball off an offensive player and out of bounds
  2. Knocking the ball away as to force a shot clock violation

The second method is inherently less valuable because it has to happen near the end of the shot clock, when the value of the possession is already reduced. Nonetheless, both are quite easy to keep track off and add to the overall picture of a player’s defensive ability to force turnovers. These kinds of forced turnovers occur at a rate of about 0.30 per 100 possessions.

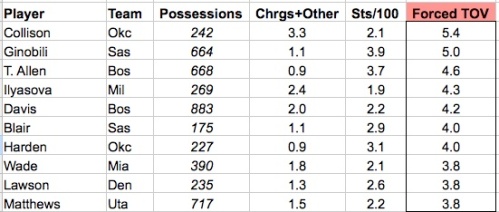
Along with steals,we can combine all of these into one defensive measure for “forcing turnovers.” Below are the leaders from the 2010 playoffs (league average was 2.09/100):

Stats are per 100 possessions

Obviously, this is quite a different list than the one portrayed by looking only at steals. Here are the complete leaders from the 2010 playoffs in non-traditional turnovers and total forced turnovers.

Read Full Post »

The traditional stat for offensive usage looks at how often a player either shoots or turns the ball over. Which means passing and creation isn’t factored into any a player’s “usage.” Using Opportunities Created, a measure of offensive creation, it’s possible to estimate a player’s contribution, or “offensive load:” the percentage of possessions a player is directly or indirectly involved in a true shooting attempt, or commits a turnover.

In other words, the higher the offensive load, the greater the role in the offense. It’s a good way to see who really is “carrying” an offense, so to speak. Here’s an example breakdown of a team’s offensive load, using last year’s Los Angeles Lakers in the playoffs:

The mathematically inclined might be asking: “doesn’t this mean a team’s total load can exceed 100%? Absolutely – which is a reflection of what is being measured. (The league average per team is about 130 per 100 possessions.) Basketball is a team game, and this method is allotting credit not only to the shooter but also to the creator.

Here are the breakdowns by position from last year’s playoffs:

As we might expect, guards carry the greatest load (they have the ball the most). Centers the smallest share. Not all too different from the traditional usage metric. Below are last year’s leaders in the playoffs compared to their usage rate:

It seems that the most active offensive players make something happen on about half of the possessions they play. “Something,” in this case, being a shot attempt, creating a shot attempt or turning the ball over.

Here is the complete list of load leaders from the 2010 Playoffs of players who logged over 150 possessions.

Read Full Post »

Besides scoring, the major contribution to a basketball offense is playmaking. Or, more specifically, the ability to draw extra defenders away from their assignments. As a measure of how well a player does this, assists leave something to be desired; they are only tallied when a pass is made to a player who scores, regardless of how helpful the pass was. Which is why we need a way to detect who creates open shots for teammates by drawing extra defensive pressure. For that, I use something I call “Opportunities Created.”

The Method

One way to do this is to track any time a second defender leaves his man in order to help defend an offensive player. This can be voluntary defensive strategy or it can be the result of the first defender being beaten off the dribble.

Such events are actually fairly easy to keep track of. Here’s a quick example from a game:

(Yes, I believe all NBA replays should be watched in Italian.) Note the first play of the video, when the ball is fed into Tim Duncan in the post. At about 0:21, help comes to double-team Duncan. This leaves Michael Finley open for a 3. The unguarded shot — regardless of the result — was created by Duncan drawing defensive help away from Finley. That is an opportunity created (OC) by Tim Duncan.

At 13:30 of the video, Dirk Nowitzki drives on Tim Duncan and forces Ginobili to help. The ball is swung around until Jerry Stackhouse ends up with a jumper (despite a nice close-out effort by Finley). That is also an OC by Nowitzki, who originally broke down the Spurs defense, despite it not registering as an assist.

Every OC has to end in some kind of attempt, even if it is a fouled attempt. If there is never a shot (or foul), there can never be an OC. (What exactly would the player have created, then?) OC’s can be registered when a player draws defensive pressure and the following occurs:

  • An open attempt
  • An open “hockey” attempt (extra passing, as in the Nowitzki play above)
  • A foul at the rim on a layup attempt (created by the scrambling of the defense)
  • An offensive rebound putback (created because the rebounder’s defender was forced to help)

The Results

As we would expect, guards create much more than bigs. They have the ball in their hands a lot, drive and dish a lot, and are often the defensive focus of pick and roll action. (It has become popular to “jump,” or trap the pick and roll to prevent the dribbling guard from penetrating or taking an open jump shot.) In last year’s playoffs, here is the positional breakdown of OC’s:

The breakdown by position is similar to data tracked this year as well.

So how well do assists correlate to OC’s? Overall, for the 133 players who logged at least 150 possessions in last year’s playoffs, the average error was 0.86 assists (with a standard deviation of 1.81 assists). Of those 133 qualifying players, the following had the largest discrepancy between assists and OC’s per 100 possesions (number of OC’s per 100 in parentheses):

  1. Rajon Rondo 6.8 (5.6 OC’s per 100)
  2. Ronny Price 5.8 (1.2 OC’s)
  3. Jason Kidd 4.7 (4.7 OC’s)
  4. Luke Walton 4.0 (4.0 OC’s)
  5. Jamrio Moon 3.9 (0.0 OC’s)

and the following players have the largest discrepancy between OC’s and assists (meaning they create more than assists would suggest):

  1. Brandon Roy 5.3 (8.7 OC’s)
  2. Nowitzki 4.0 (8.3 OC’s)
  3. Ginobili 3.3 (12.4 OC’s)
  4. Westbrook 2.8 (11.7 OC’s)
  5. Reddick 2.4 (6.3 OC’s)

I will post the complete leaders from last year’s playoffs in a follow up post.

The Discussion

There is a fairly strong correlation with assists (R=0.83). However, the error rate in certain players is enormous, which was the impetus for the stat in the first place; we want to know who’s creating opportunities, not simply who is passing to good players.

It might be worthwhile to simply track double-teams, but there isn’t always an attempt of some kind after a double team. Sometimes, the ball is re-entered into the post and a second or third double team can come on the same possession. If the player turns the ball over, nothing positive came from the double team.

Future consideration should be given to the defensive version of this metric: “OC’s Against.” Those occur every time a defender has a teammate help him in his assignment. If a player never needs defensive help, it means that he is never responsible for the offensive “power plays” (4 on 3 on the rest of the court) that occur because of an OC.

Another useful follow up exercise would be to look for “ball-stoppers.” Most NBA players and teams are coached well enough to take advantage of the power play provided  when two defenders commit to one offensive player. Every once in a while, a player will allow the defense to recover and lose that advantage by holding the ball or not shooting when he should shoot, allowing a scrambling defense to recover. It’s fairly easy to spot, and seems worth tracking in the future.

Read Full Post »