Feeds:
Posts
Comments

Posts Tagged ‘Defensive Role’

I’ve talked about “guarded situations” before, but never from the perspective of an individual defender. We can use a “guarding situation” as a quick and dirty operational definition for looking at FG% against individual defenders. To reiterate the definition of a guarded situation:

  • The defender is trying to defend an offensive player without being impeded by a screen or helping on defense
  • The defender is challenging an offensive player at the basket by “engaging” in guarding them
  • The defender is double-teaming in a manner that actually impacts the opponent’s shot

The first situation has a gray area when players are screened out and then “re-engage” in guarding them (or switch on screens and pick up a new man). I look at the defenders stance and spacing from the offensive player to determine if he’s re-engaged: If the defensive player hasn’t had time to establish that position as he otherwise would have, he hasn’t engaged the offensive player again. (For eg, scrambling and lunging at a shot attempt from 4 feet away after being screened isn’t “guarding,” it’s more akin to closing out on a jumper shot.)

The second situation is fairly straightforward — Dwight Howard isn’t engaged in “guarding” a player by leaping across the lane at the last second, after a shot is taken, trying to block it. That’s the equivalent of a closeout on a jump shot, and for these purposes ignored (unless the shot is literally blocked). But when he’s standing in the lane and picks up the attacker coming toward the rim, he is now guarding the offensive player.

The last situation is simply to clarify that an incoming double-team is not an engaged double-team. If Dwayne Wade runs at a post player to double, he isn’t actually guarding him until he gets there. Engaged double- teams count as half attempts for each defender.

From that definition, we can look at how players shoot against defenders. The average guarded shot in 164 team games tracked this year is 40.6%. In last year’s playoffs, it was 39.6%, mostly due to the number of games played by good guarding teams like Boston (35.6% against), Orlando (36.6% against) and Los Angeles (38.0% against).

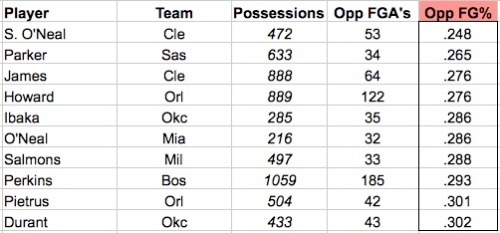
Here are the individual leaders from the 2010 playoffs in FG% against (min 30 FGA):

2010 Playoff Leaders FG% Against; Min 30 FGA's

There are some not-so-surprising names on that list. Players with good defensive reputations like LeBron James, Howard, Serge Ibaka and Kendrick Perkins. Although it’s always important to keep in mind that playoff samples are heavily influenced by the matchups from a series or two.

There are surprising names there too, perhaps most notably Tony Parker. After 26 FGA against this year, Parker’s opponents are shooting 50%. Ah, small sample sizes! Here are the leaders from games tracked in the regular season so far this year (min 30 FGA):

Min 30 FGA

Again, it might be surprising to see Jason Kidd’s name there, but he just missed the cut for the playoff leaders last year — 31.3% against. Even at his advanced age, he can still defend quite well, and I imagine his large frame and intelligent positioning make scoring on him more difficult than normal.

Another name that might stand out, other than Shannon Brown, is Derek Rose. I will have a post on Rose and the Bulls defense in the near future, but there is no doubt Rose’s athleticism has made him a really solid defender at the point guard position.

Included here is the complete list of qualifying players in FG% against from 2010 playoffs.
Read Full Post »

A few posts back, I introduced the concept of defensive usage and attempted to quantify it. That iteration of the metric was rough and did not include a number of events on defense that I’ve now added to the statistic. This version now incorporates the following:

  • Defensive errors
  • Forced turnovers
  • Double-teams

Which means that the more subtle elements of team defense are still being overlooked. “Deterrence” is probably the most difficult factor to qualify: when a good rotation deters a pass, when a good rotation deters dribble penetration and nothing much comes of it or when good on-ball defense deters a shot. Then there are the degrees of basic defensive principles: how well a player closes out, how quickly a player makes a correct rotation, how good on-ball defenders are at preventing penetration and the ability to hedge screens.

So, this is not a perfect measurement of defensive contribution. But it is a fairly relevant one and a good starting place considering the general paucity of defensive information in basketball analysis.

Using this updated methodology, we now see the following positional breakdown by DUsg:

A few comments:

  • The sample is over 2943 possessions involving 233 players on 22 teams
  • Defensive Usage still does not sum to 100% due to reasons previously explained
  • There is essentially no difference in turnovers forced between positions

This gives us a fairly clear picture that interior players, on average, shoulder a larger defensive role than perimeter players. It is important to note that this is not a true mirror statistic to offensive usage because they are measuring different things. Neither is comprehensive, and in this case neither is measuring an equal portion of offensive and defensive events.

Some people might argue that what this methodology is missing overlooks wing players more than bigs. After all, with today’s NBA rules perimeter players move freely and dominate on offense. The ability to deter movement and stop penetration is incredibly important. Then again, all of the subtle positioning and help action by bigs in the paint likely offsets this to a large degree.

Finally, these are averages – outliers exist. It is possible for certain players to buck the trend. In the future I will post individual leaders using this methodology. As of writing this, the highest DUsg from a perimeter defender is 19.3% (Luol Deng, Chicago, in 359 possessions).

Read Full Post »

Usage is a term typically associated with offense. It’s an estimate of how often a player “uses” an offensive possession (the standard formula involves true shot attempts and turnovers). But we can think of usage in terms of defense too. That is, how often a player has a shot attempt taken by someone he is in the act of guarding.

According to my tracking, in the 2010 NBA Playoffs, 56.3% of true shot attempts (FGA’s + 0.44 * FT’s) were taken while being guarded. 14.0% of possessions ended in turnovers. The other 29.7% were either:

  • open shots (as a result of a defensive breakdown, defenders being effectively screened out or from transition opportunities)
  • free throws (from non-shooting fouls — the penalty — intentional fouls and technical fouls)

Of the 56.3% of TS attempts that were guarded, the positional breakdown is as follows:

As expected, PG’s foul in the act of shooting less, they face fewer shots when guarding, and as a result fewer TS attempts. It scales up the “bigger” the position, with bigs facing more than half of the shots despite occupying only two of the five positions on the court. This is primarily because they play close to the basket and engage all of the players driving down the lane while protecting the basket.

In America’s favorite visual form, the pie chart, it looks like this:

This means that the range of defensive impacts will be much wider for interior players than perimeter plays. The difference between a good and bad defensive point guard won’t be nearly as pronounced as the difference between a good and bad defensive center. Using a simple mathematical example, imagine the following:

  • A “Bad” Defender allows 50% eFG shooting
  • A “Good” Defender allows 40%e FG shooting

Assume free throw accuracy is a constant (the league average). Based on these shooting percentages, at the center position the difference between our bad defender and good defender is 2.9 pts/100 (a difference in efficiency this year between an average team and the 8th-best team). But at PG, the difference between our good and bad defenders shrinks to 1.2 pts/100.

But that’s just looking at shooting. If we want to create a “Defensive Usage” stat to mirror the offensive one, we need to incorporate turnovers as well. When we do that, we end up with the following positional breakdown:

Practically speaking, individual defenders can have a slightly larger influence than presented above, as this methodology ignores factors like deterring a shot in the first place, defending the 3-point line and disrupting penetration on pick and rolls (incredibly valuable in today’s game). Those tasks fall primarily on the shoulders of little guys, so it’s possible for them to make up some of the difference in “usage” there. Nonetheless, it should seem quite intuitive that the giant men who protect the basket face the most shots — and the most high-efficiency shots — in a position to grab the most rebounds, and thus have the largest impact on the defensive end.

One last point to note is that all of this explains why great individual defensive players can’t have the same impact great individual offensive players can have. This should also be intuitive, as on offense, teams can choose to run the majority of plays through one player. On defense, they can’t choose to have the other team always attack their best defender; Great defenders are essentially saddled by guarding their own man or helping on a slasher down the lane. But as you can see, even that doesn’t involve them on nearly as many possessions as is possible on offense.

We can compare our new Defensive Usage stat with the traditional offensive Usage stat. Here are the leaders from last year’s playoffs:

Offensive Usage (min 300 possessions)

  1. Durant – 34.0%
  2. Wade – 34.0%
  3. Bryant – 33.2%
  4. Anthony – 32.1%
  5. Rose – 31.5%

Defensive Usage (min 300 possesions)

  1. Gortat – 23.7%
  2. Perkins – 21.6%
  3. Frye – 20.9%
  4. T. Allen – 19.4%
  5. McDyess – 19.4%

In reality, the difference is even greater than seen here because of the number of plays in which an offensive player creates for others yet the result isn’t attributed to usage totals. Although that’s the topic of a future post.

Read Full Post »