Feeds:
Posts
Comments

Unless something drastic happens in the final weeks of the NBA season, Derrick Rose is going to win the MVP. He’s not a horrible choice — he’s in the top-5 on my ballot — but he’s probably not the correct choice. His supporters point to Chicago’s immense improvement from a year ago in the face of injuries to Joakim Noah and Carlos Boozer, who have missed a combined 54 games due to injury.

Only Rose isn’t responsible for a lot of that improvement.

It’s been well documented that under rookie coach Tom Thibodeau, Chicago has one of the top defenses in the NBA. The Bulls have improved their offensive rating 4.3 points, from 103.5 to 107.8, and their defensive rating 5.3 points, from 105.3 to 100.0. Here’s Rose’s individual improvement from last season to this:

Stats per 36 minutes

There’s no doubt he’s improved offensively and that has driven Chicago’s offensive improvement. Of course, the Bulls defensive improvement has been even more significant, and Rose plays a relatively small role in Chicago’s defensive dominance.

In 14 Bulls games I’ve tracked this year, the Bulls are boasting a 113.2 ORtg and 100.7 DRtg. The team breakdown is as follows:

Pos: Possesions played, OC: Opportunities Created, FD: Fouls Drawn

Rose’s huge EV numbers currently ranks 3rd in my database this year (although his outperforming his season averages on offense in this sample). He’s certifiably playing like a monster. His offensive load of over 54% — tops in the league — is indicative of just how much he does for Chicago on that end. He’s 2nd in Opportunities Created and 14th in assists per game, so it’s not just a shooting festival. Let’s give Rose a lot of offensive credit, but keep in mind that he’s not quite Steve Nashing* a weak offensive team, he’s Allen Iversoning* a weak offensive team. (Yes, players can be verbs too.)

*Nashing – to quarterback an otherwise weak offense to a top offense in the league. Also a superior version of “Iversoning,” which is carrying a weak offense to respectability.

Rose is a good defender too, but he’s not largely responsible for his team’s performance on that side of the ball: Chicago’s defense with Rose on the court is 101.8. Without Rose, it’s 93.1. From the 14 games I’ve tracked, Rose has the second lowest defensive usage on the team. Not surprisingly, Chicago’s defense is powered by players like Noah, Asik, Deng and Ronnie Brewer. Just from their defense, Chicago is getting about 19 or 20 wins above .500. The offense is dead average.

(It’s also impossible to ignore the value of COY Thibs. It’s rare we can clearly point to a coach lifting a team a few SRS points, and Thibs does that with his defensive schemes. Their rotations are ridiculously tight and they are as good in that department as the historical 2008 Celtics D.)

And lost in the Bulls shuffle is the all-star level play of Luol Deng. He’s defending incredibly well, and having his best offensive season since 2007. Even Deng’s three most frequent lineups without Rose have done well.

Not surprisingly, Chicago doesn’t have a large overall point differential with and without Rose (+1.2 with him). In 826 minutes, the Bulls are a staggering +7.3 without Derrick Rose. That’s not to say he isn’t great — he is — but starting with Chicago’s impressive record and distributing credit to Rose from there is giving him equal-part credit for their team defense, and that’s just wrong.

Rose is buoying the offense from below average to average, which shouldn’t be ignored. That’s precisely the reason he is a viable MVP candidate. But for people to think Rose is the reason for a 20-win jump like we’re seeing with Chicago is a gross misapplication of credit.

I’m a big fan of On/Off data, which compares a team’s point differential with a player on the court versus when he’s off the court. I’ve referenced it frequently in the past and think it’s one of the more telling reflections of a player’s value to his team in the advanced stat family.

The nice part about On/Off is that it represents what actually happened. The problem with On/Off is it ignores the reasons why it happened. And sometimes, it creates a fuzzy picture because of it.

For example, let’s suppose Kobe Bryant plays the first 40 minutes of the a game and injures his ankle with the score tied at 80. LA wins the game 98-90. The Lakers were dead even when he was in the game, and +8 with him out of the game – Bryant’s on/off would be -8.

In this case, sample size is an issue. But that becomes less of a problem over the course of an entire season. The real concern is the normal variance involved in everyone else’s game. Practically speaking, it takes little outside the norm for Kobe to have played 40 brilliant minutes while his teammates missed a few open shots, and for the opponent to miss a few open shots down the stretch while Kobe’s teammates start hitting them.

The tendency is to look at a result like that and conclude that Kobe hurt his teammates’ shooting and when he left the game it helped their shooting. He very well may have by not creating good looks for them.

Then again, players hit unguarded 3-pointers about 38% of the time. Which means if the average shooter attempts five open 3-pointers, he will miss all five about 10% of the time, simply based on the probabilistic nature of shooting. A fact that has little to do with Kobe or any of the other players on the court.

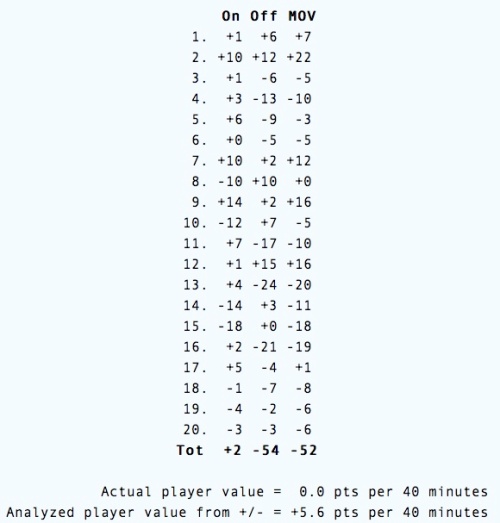
In our hypothetical situation, all it takes is an 0-5 stretch from the opponent and a 3-5 stretch from LA to produce Kobe’s ugly -8 differential. The great college basketball statistician Ken Pomeroy ran some illuminating experiments on the natural variance in such numbers. His treatise is worth the read, but the gist of it is that his average player — by definition — produced a -57 on/off after 28 games (-5.7 per game) due to standard variance in a basketball game outside of that player’s control. Think about that.

For fun, I just ran the same simulation and my average player posted a +5.6 rating of his college season:

Average Player Simulation

So in two simulations, the average player’s On/Off ranged from -5.7 to +5.6. One guy looks like an All-Star, the other like an NBDL player.

“The Team Fell Apart When Player X Was Injured”

This is a common argument for MVP candidates: Look at how the team fared when he missed a few games and conclude the difference is the actual value a player provides to his team. Only this line of thinking runs into the same problems we saw above with on/off data.

Let’s take Dirk Nowitzki and this year’s Dallas Mavericks. In 62 games with Dirk, Dallas has a +4.9 differential (7.8 standard deviation). In nine games without Dirk, a -5.9 differential (7.5 standard deviation).

Which means, with a basic calculation, we can say with 95% confidence that without Nowitzki, Dallas is somewhere between a -1.0 and -10.8 differential team. Not exactly definitive, but in all likelihood they are much worse without Dirk. OK…but we can’t definitively say how much worse they are.

In a small sample, we just can’t be extremely conclusive. In this case, nine games doesn’t tell us a whole lot. New Orleans started the season 8-0…they aren’t an 82-win team.

We can perform the same thought-experiment with Dirk’s nine games that we did with Kobe’s eight minutes to display how unstable these results are. Let’s say Dallas makes three more open 3’s against Cleveland and the Cavs miss three open 3’s. What would happen to the differential numbers?

  1. That alone would lower the point differential two points per game.
  2. Our 95% confidence interval now becomes -12.1 points to +4.4 points.

That’s from adjusting just six open shots in a nine game sample.

Jason Terry — a player who benefits from playing with Dirk Nowitzki historically — had games of 3-16, 3-15 and 3-14 shooting without Dirk. He shot 39% from the floor in the nine games. By all possible accounts, Terry is better than a 39% shooter without Nowitzki. He shot 26% from 3 in those games. Let’s use his Atlanta averages instead, from when he was younger and probably not as skilled as a shooter: How would that change the way Dallas looks sans-Dirk?

Well, suddenly Terry alone provides an extra 1.7 points per game with his (still) subpar shooting. The team differential is down to -2.2 with a 95% confidence interval of -10.4 to +6.1. Just by gingerly tweaking a variable or two, the picture grows hazier and hazier.

Making Sense of it All

So, what can we say using On/Off data? It’s likely Dallas is a good deal better with Dirk Nowitzki. But, hopefully, we knew that already.

To definitely point to a small sample and say, “well this is how Dallas actually played without Dirk, so that’s his value for this year” ignores normally fluctuating variables — like Jason Terry or an open Cleveland shooter — that have little to do with Dirk Nowitzki’s value. So while such data reinforces how valuable Dirk is, we can’t say that’s how valuable he is.

We can’t ignore randomness and basic variance as part of the story.

When the playoffs roll around (April 16, 2011) NBA teams typically shorten their rotations and bank on core units to play heavy minutes. I thought it would be worth examining the top 5-man units in the league this year, since (in theory) they will be logging more minutes in the postseason than they have throughout the year.

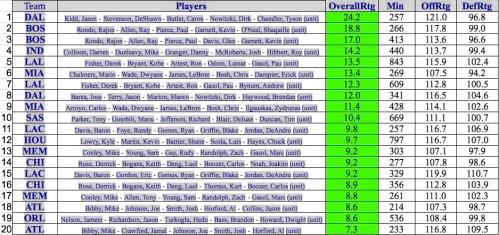
From Basketball Value, here are the top 5-man units in the league this year with a minimum of 200 minutes played (OverallRtg is the net difference per 100 possessions, or Offensive Rating minus Defensive Rating):

From basketballvalue.com; Numbers through March 23, 2011

So, in a relatively small sample (257 minutes) Dallas boasts the league’s best – err, wait a second. Caron Butler is part of that league-best unit for the Mavs, and unofficially, he is out for the season. So that lineup has no relevance going into the postseason. Which makes the best lineup the Boston Celtics starting five with Shaquille O’Neal at center…only Shaq has been out with a mysterious achilles injury since February 2.

After all the trades and injuries, that list deserves some housekeeping. The above rankings also include multiple lineups from the same team, so let’s only look at each team’s top 5-man group so we can rank teams by their best lineup.

Here is what that new list looks like, filtering for lineups (1) that still exist and (2) played a minimum of 200 minutes:

From basketballvalue.com; Numbers through March 23, 2011

Some notable new lineups are missing after the active trading spree this year:

Upon seeing Indiana’s place on that list, one’s first reaction might be shock and an undesirable itch to refresh the browser and make sure it’s parsing correctly. Thanks to the wizardry of basketballvalue, we can see the teams this Pacers group has done damage against; There’s no cause for panic.

The Indiana unit has outscored opponents by 125 points, with 54% of that differential amassed in games against nine sub-.500 teams — Sacramento, Cleveland, Washington, Toronto, New Jersey, Milwaukee, Minnesota, Charlotte and Detroit — with a combined win percentage of .299. Reassuringly, it’s just Fool’s Gold.

Is This a Good Historical Predictor?

A quick cursory glance using the 20-20 vision of hindsight shows:

In 2010, the top lineups by this measure were:

  1. Dallas (18.8)
  2. Phoenix (16.6)
  3. Orlando (16.4)
  4. Portland (16.2)
  5. Milwaukee (14.3)
  6. Boston/LA Lakers (13.3)

Portland can be excused because of Brandon Roy’s injury. Dallas lost to San Antonio (9th last year), and the Suns surprised some people by pushing the Lakers to the brink for the WCF title. Boston, sporting the league’s 10th best SRS, knocked off Cleveland (12th last year). Milwaukee is a notable outlier. Then again, Utah was 3rd in SRS and had the 19th-ranked team by lineup – the Jazz were swept by LA in the second round.

In 2009, the top lineups were:

  1. Orlando (23.8)
  2. Cleveland (19.5)
  3. Portland (18.5)
  4. LA Lakers (18.1)
  5. Dallas (11.4)
  6. Boston (11.1)

Orlando made a “surprising” run to the Finals. Portland lost to Houston (8th), although Nic Batum only played 63 minutes in the series and he was part of their token lineup. Boston was missing Kevin Garnett. And the major outlier was Denver (19th), who knocked off Dallas in the second round. Again, Utah fared well in SRS (8th) but finished just 18th in 5-man unit rankings. The Jazz lost in five games to LA.

It looks like there is good predictive value — especially when compared to SRS — in looking at top 5-man units. Which means the Bulls might have to wait for a 7th championship banner. Food for thought with the playoffs on the horizon.

In the last post, we looked at the leaders in Expected Value (EV) on the defensive side of the ball for the 2010 playoffs. Not surprisingly, Dwight Howard was the winner there. Now let’s look at the offensive leaders in EV from the 2010 playoffs. There are three notable additions to the classic box score involved in that calculation:

“Help Needed” includes all of the points scored that were created by a teammate. I will have a post about it in the near future, but for now, think of Kobe Bryant driving down the lane and drawing hordes of defenders (an OC), setting up Andrew Bynum for an open dunk. In that case, Bynum’s dunk loses some value because it was created by another teammate. More on this in the future, though.

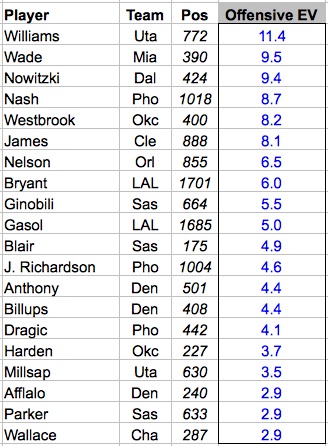
Here are the leaders in offensive EV from the 2010 playoffs, minimum 300 possessions played. All EV values are relative to league averge:

Offensive EV Leaders, 2010 Playoffs

As always, with playoff data, it’s important to remember particular matchups. Last year, Deron Williams dissected a soft Denver defense and then he made Derek Fisher look like an AARP member. Utah actually boasted the second best Offensive Rating in the playoffs — 114 pts per 100 possessions — but the defense let them down mightily. Here is the complete list of leaders in Offensive EV from the 2010 playoffs, minimum 300 possessions played.

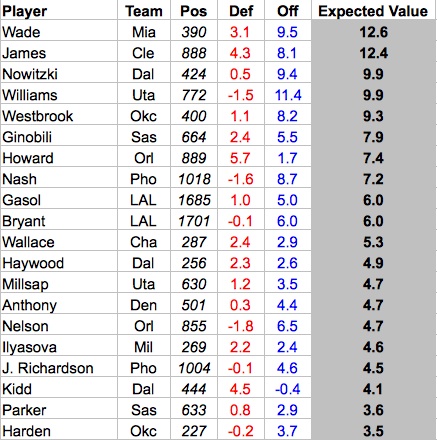
Finally, we can combine the defensive and offensive components and view the overall Expected Value leaders from the 2010 playoffs:

2010 Playoffs, min 150 possessions; Def=Defensive EV; Off=Offensive EV

By just about any measure, Dwyane Wade had a fantastic series against Boston’s vaunted defense. LeBron James’ second round against Boston wasn’t quite as good (8.5 EV), but he tortured Chicago in the opening series. Of the three superheroes, Kobe had it the worst of against Boston, posting a 3.4 EV in the Finals.

For reference, the top series performances by EV from the 2010 playoffs (EV in parentheses):

  1. James vs. Chi (16.2)
  2. Gasol vs. Uta (12.8)
  3. Howard vs. Atl (12.5)
  4. Nelson vs. Cha (12.5)
  5. Wade vs.Bos (11.8)
  6. Bryant vs. Pho (11.8)
  7. Nash vs. SAS (10.8)
  8. D Will vs. Den (10.2)
  9. Dirk vs. SAS (9.3)
  10. James vs. Bos (8.5)

Paul Gasol had the highest EV of the 2010 NBA Finals (5.0). Here is the complete list of EV leaders from the 2010 playoffs, minimum 150 possessions played.

If you missed the last post, it was an overview of Expected Value (EV). And while that approach is not a novel concept — check out this similar method — from what I gather, incorporating a large defensive component is. Most of the defensive numbers used are from my stat-tracking. As a refresher, the defensive component of EV includes:

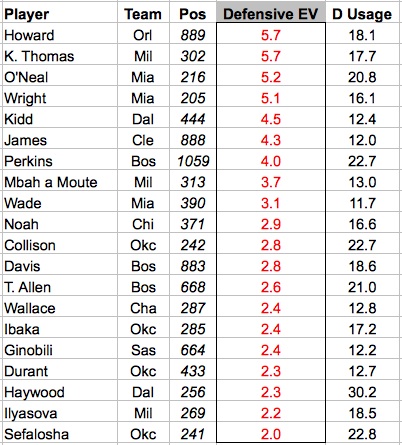
So which individual players fare the best in this metric? Below are the top defensive players in EV from the 2010 playoffs, with defensive usage included as a reference for the size of a player’s role (minimum 30 defensive plays “used”):

2010 Playoffs; Minimum 30 defensive possessions used

Dwight Howard, not surprisingly, had the best playoffs on the defensive end according to this. It’s good to be cautious of how small-sampled the playoffs are, given that one or two games against a hot or cold shooting opponent could skew these numbers. Then again, half the all-defensive team is represented on the list above, and that doesn’t include reputable defenders like Joakim Noah, Luc Richard Mbah a Moute and Tony Allen.

Because the playoffs are not only small sampled in games, but in opponents, it’s always important to consider matchups. Which makes Allen’s performance — mostly versus Dwyane Wade, LeBron James and Kobe Bryant — that much more impressive.

For those wondering about Kevin Garnett and Tim Duncan, they both just missed the cut. Garnett, to me, emphasizes the single greatest challenge in measuring individual defense causally: his greatest strength is probably communicating where to be and what is coming at all times to those around him. Now that’s difficult to quantify.

Finally, here is the complete list of defensive EV from the 2010 playoffs for all qualifying players (min 30 defensive possessions “used”).

Author’s Note: All EV values are relative to league average.

Expected Value (EV)

Some time ago, I began wondering what the value of certain actions in a game were. How did they translate to points, since points determine who wins based on the rules of the game?

So much goes in to scoring points: first one needs possession of the ball. Well, stop right there. How much is possession of the ball worth? On average, about 1.07 points. How much is a turnover worth, then? If it’s the loss of a possession, it should be worth about -1.07. Then what is the value of a missed field goal? Well, it’s failing to score on a possession, but on average, 26% of the time the offense still recovers the rebound, so it’s not quite as bad as a turnover. So 1.07 * 0.74 means a missed field goal is approximately -0.79 points. And so on…

I call this model “Expected Value,” as a tip of the cap to my poker background. Viewing actions this way isn’t new — PER uses value of possession concepts — but there are stats in play here that haven’t been used before.

A huge component of this rating is introducing defensive statistics in order to ballpark players defensive performances. On the offensive end, its major novel component is accounting for distributing the share of offensive scoring between creators and those they created for. The “helped” elements in the table below are an estimate of how much credit should go to the creator of an open layup, shot or layup foul (one of those fouls in which the player is intentionally fouled from behind to prevent a dunk).

Since EV is using novel stats from my stat-tracking (linked to in the tables below), it’s not even 400 games old (stat-tracking from the 2010 playoffs and 2011 regular season). Nonetheless, on the last round of correlations I tested, the correlation coefficients were as follows:

  • Offensive EV to ORtg: 0.97
  • Defensive EV to DRtg: -0.80
  • Expected Value to Overall Efficiency: 0.91

Interesting correlations given that the model is built around causality. And the correlations are even stronger when including Help Needed, the defensive counterpart to Opportunities Created. Without further ado, here are the marginal values used for EV. First, the defensive values:

Event Marginal Value
3-point FG Against -1.93
2-point FG Against -0.93
Defensive Error -0.65
Shooting Free Throw -0.47
Charge 1.20
Forced Turnover 1.07
Missed FGA Against 0.79
Defensive Rebound 0.28
Block 0.15

Offensive Values:

Event Marginal Value
Made 3-pt FG 1.93
Made 2-pt FG 0.93
Offensive Rebound 0.79
Opportunity Created 0.50
Made FT 0.47
Foul Drawn 0.30
Assist 0.30
Turnover -1.07
Missed FGA -0.79
Missed FTA -0.40
Helped Layup -0.70
Helped 2-pt FG -0.37
Helped 3-pt FG -0.35
Helped FTA -0.27

Other:

Event Marginal Value
Technical Foul -0.76

What’s Missing

Astute observers will notice there is absolutely no accounting for screens. Most players set similar screens, with a few outliers on both ends, generally determined by size. Comparably, most defensive players handle screens similarly (I’ve yet to see the player who can run through a screen), although some outliers hedge them better than others.

Which leads to another, difficult to quantify issue: spacing. This is also a small issue in most cases, but great shooters will prevent defenses from collapsing too much into the lane. It’s extremely hard to quantify how often a defender is reluctant to sag off of a shooter, especially since most players will double and rotate appropriately even if they are guarding Ray Allen.

Some other major elements still missing that might be possible to quantify in the future with devices like optical tracking:

  1. Shots deterred
  2. Quality of “closeouts”
  3. How long a player holds the ball and mucks up an offensive possession

A final note: Player ratings and comprehensive metrics are often polarizing. Fans tend to cling to metrics they intuitively like or ones that their favorite players do well in, or they tend to ignore metrics for converse reasons. Both extremes often miss what exactly it is the metric is representing. I’ve written about the major players in the advanced stat community before, and my hope is that people keep that in mind when viewing Expected Value. It is still a work in progress. (For example, an obviously superior model would be “Dynamic EV”, which incorporates how the values of events change as the shot clock changes and how they change based on opponent.)

In the next post I will look at the defensive leaders in this metric from the 2010 playoffs.

FG% Against

I’ve talked about “guarded situations” before, but never from the perspective of an individual defender. We can use a “guarding situation” as a quick and dirty operational definition for looking at FG% against individual defenders. To reiterate the definition of a guarded situation:

  • The defender is trying to defend an offensive player without being impeded by a screen or helping on defense
  • The defender is challenging an offensive player at the basket by “engaging” in guarding them
  • The defender is double-teaming in a manner that actually impacts the opponent’s shot

The first situation has a gray area when players are screened out and then “re-engage” in guarding them (or switch on screens and pick up a new man). I look at the defenders stance and spacing from the offensive player to determine if he’s re-engaged: If the defensive player hasn’t had time to establish that position as he otherwise would have, he hasn’t engaged the offensive player again. (For eg, scrambling and lunging at a shot attempt from 4 feet away after being screened isn’t “guarding,” it’s more akin to closing out on a jumper shot.)

The second situation is fairly straightforward — Dwight Howard isn’t engaged in “guarding” a player by leaping across the lane at the last second, after a shot is taken, trying to block it. That’s the equivalent of a closeout on a jump shot, and for these purposes ignored (unless the shot is literally blocked). But when he’s standing in the lane and picks up the attacker coming toward the rim, he is now guarding the offensive player.

The last situation is simply to clarify that an incoming double-team is not an engaged double-team. If Dwayne Wade runs at a post player to double, he isn’t actually guarding him until he gets there. Engaged double- teams count as half attempts for each defender.

From that definition, we can look at how players shoot against defenders. The average guarded shot in 164 team games tracked this year is 40.6%. In last year’s playoffs, it was 39.6%, mostly due to the number of games played by good guarding teams like Boston (35.6% against), Orlando (36.6% against) and Los Angeles (38.0% against).

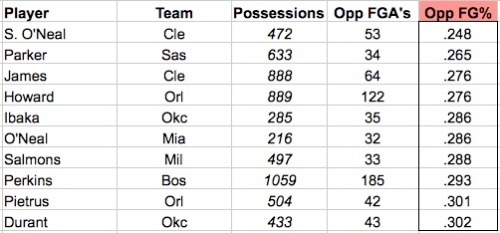
Here are the individual leaders from the 2010 playoffs in FG% against (min 30 FGA):

2010 Playoff Leaders FG% Against; Min 30 FGA's

There are some not-so-surprising names on that list. Players with good defensive reputations like LeBron James, Howard, Serge Ibaka and Kendrick Perkins. Although it’s always important to keep in mind that playoff samples are heavily influenced by the matchups from a series or two.

There are surprising names there too, perhaps most notably Tony Parker. After 26 FGA against this year, Parker’s opponents are shooting 50%. Ah, small sample sizes! Here are the leaders from games tracked in the regular season so far this year (min 30 FGA):

Min 30 FGA

Again, it might be surprising to see Jason Kidd’s name there, but he just missed the cut for the playoff leaders last year — 31.3% against. Even at his advanced age, he can still defend quite well, and I imagine his large frame and intelligent positioning make scoring on him more difficult than normal.

Another name that might stand out, other than Shannon Brown, is Derek Rose. I will have a post on Rose and the Bulls defense in the near future, but there is no doubt Rose’s athleticism has made him a really solid defender at the point guard position.

Included here is the complete list of qualifying players in FG% against from 2010 playoffs.

Defensive Errors

There are a few ways offenses end up with unguarded shots, either in transition, off of screens and when defenses make errors. The thinking here is (deliberately) quite simple: defenders should be guarding someone. If they aren’t, they should be rotating or hedging a screen to resume guarding someone. The goal is to not give up open shots, which is always trumped by the goal to not give up open layups.

I categorize defensive errors in two ways:

  1. A blow-by
  2. A missed rotation

The first is an error in man defense, when one’s man beats them to the rim – “blows by them,” in hoops vernacular – either with the ball or off the ball. It’s a “blow-by” when the defender is no longer engaged in guarding the player. The second is an error in team defense, when players fail to logically rotate to an open defender, or even worse, don’t rotate to the rim to prevent an open layup (the majority of “missed rotations”).

In either case, two players can receive half an error each if two players were equally involved in the error. For a blow-by, this is simply when a double-team is split and left in the dust, but for a missed rotation it is equally blaming two proximal defenders who could have rotated to an open man and did not. It’s common for half missed rotations to take place when two players incorrectly rotate to the same shooter on the perimeter and fail to collectively protect the rim against an open layup. (They usually then start pointing at each other or looking around in befuddlement. The lesson: defensive communication is important!)

Defensive errors essentially create a power play — similar to the power play we saw in opportunities created — that spikes the opponent’s offensive efficiency by nearly 50%. In the simplest terms, tracking defensive errors is assigning responsibility to players who give up open shots when they otherwise shouldn’t.

As is the case with assigning credit for an assist, there is a gray area (mostly involving whether a player could have rotated and didn’t).

Some examples of defensive errors:

  • Being beaten off the dribble and no longer being within reach of the dribbler (BB)
  • Being backdoor cut on the wing without staying with the cutter (BB)
  • Being run by on the way down the court by your man (BB)
  • Failing to rotate to the basket when the screener rolls free as his defender double-teams the dribbler (MR)
  • Failing to rotate to a man to box out after a similar defensive scramble (MR)
  • Staying in the backcourt (cherry-picking) and not running back in a reasonable time to defend anyone (MR)

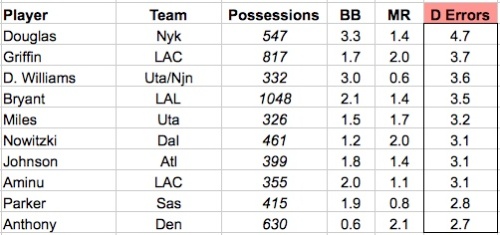
Through March 15 (162 team games tracked), here are the players with the  most defensive errors in the 2011 regular season (minimum 300 possessions played):

Statistics are per 100 possesions; BB = Blow By; MR = Missed Rotation

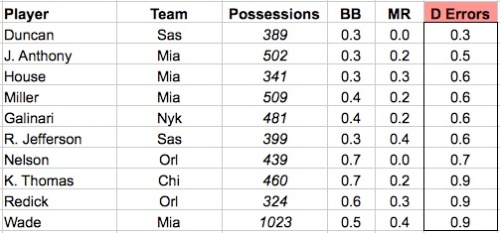
And the players with the fewest defensive errors:

Statistics are per 100 possesions; BB = Blow By; MR = Missed Rotation

*Qualifier players for leaders listed in this post play for: Atlanta, Boston, Chicago, Dallas, Denver, Indiani, LA Clippers, LA Lakers, Miami, New Orleans, New York, Oklahoma City, Orlando, Phoenix, Portland, San Antonio, Utah. Remaining teams don’t have 300+ possessions in the 2011 database.

For those wondering, the correlation coefficient between defensive errors and team defensive rating this year is about 0.35.

In 1974, the NBA started tracking steals. And apparently, they thought that was a sufficient measure of forcing turnovers on defense, because they haven’t added anything related in their box score since.

The easiest measure of forcing turnovers is to track offensive fouls drawn. Hoopdata provides charges taken, although nothing is listed for the 2011 season. In my stat-tracking, I note any offensive foul drawn, excluding the moving screen.

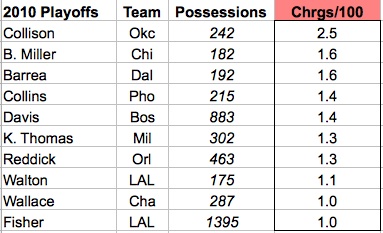
In last year’s playoffs, the average player drew 0.31 offensive fouls per 100 possessions. In tracking games this year, that number is 0.49/100 possessions (there was a lot of good offense in the 2010 postseason, despite the NBA Finals). Here are the leaders in “charge” rates — offensive fouls taken per 100 possessions — from last year’s playoffs:

Nick Collison was hitting the deck like a sailor in the Thunder’s six games against LA. Derek Fisher drew the most total charges, with 14. A familiar name for those who are abreast to charge-related statistics is Glen Davis, who was this year’s NBA leader at the last unofficial count I heard.

***

There are other ways to force turnovers on defense that don’t reach the box. There are two in particular that I track and both have to do with deflecting the ball in a manner not registered as a steal:

  1. Knocking the ball off an offensive player and out of bounds
  2. Knocking the ball away as to force a shot clock violation

The second method is inherently less valuable because it has to happen near the end of the shot clock, when the value of the possession is already reduced. Nonetheless, both are quite easy to keep track off and add to the overall picture of a player’s defensive ability to force turnovers. These kinds of forced turnovers occur at a rate of about 0.30 per 100 possessions.

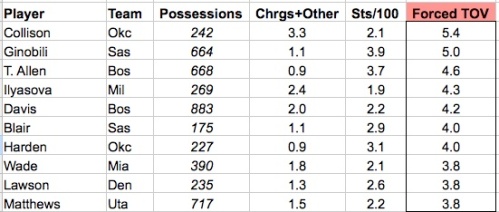
Along with steals,we can combine all of these into one defensive measure for “forcing turnovers.” Below are the leaders from the 2010 playoffs (league average was 2.09/100):

Stats are per 100 possessions

Obviously, this is quite a different list than the one portrayed by looking only at steals. Here are the complete leaders from the 2010 playoffs in non-traditional turnovers and total forced turnovers.

In a post last week debunking the nuclear overreaction to Miami’s late-game failures, I alluded to the Heat’s lack of depth and size. Which led me to thinking, just how little is Miami — still 43-21 and the boasting the best schedule-adjusted differential in the league — receiving from its non-stars?

According to broadcaster Eric Reid, the Heat’s bench has accrued 22% of the team’s points this year; Dead last in the NBA. This wouldn’t be too big of an issue if the Heat’s starters were a well-oiled, balanced machine.

They aren’t.

Using the Simple Rating at 82games (a combination of on/off and production), the Heat have two superstars, a good third player, and only two players hovering around even (James Jones and Zydrunus Ilgauskas). The elite teams giving them trouble have the following distribution (total quality players in parentheses):

  • Chicago (9 quality players): 1 good player, 3 positives, 5 players around even
  • LA Lakers (7): 4 good players, 2 positives, 1 player around even
  • Boston (6): 1 elite players, 2 good players, 1 positive, 1 player around even
  • Dallas (6): 1 elite player, 1 good player, 2 positives, 2 players around even
  • Orlando (6): 1 elite player, 1 good player, 1 positive player, 3 around even
  • San Antonio (6): 1 elite player, 1 good player, 3 positive players, 1 around even
  • Oklahoma City (6): 1 good player, 2 positive, 3 around even

Miami may have the best duo in the league, but they are somewhat redundant in role (neither can guard centers, neither can shoot 3’s too well). Another quality player, especially on the interior, would do wonders for Miami. Dean Oliver thinks less dribbling from the stars might also help help create better shots and offensive balance.

***

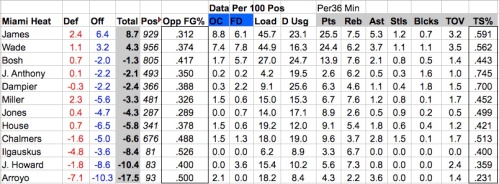
In my own stat-tracking, I’ve charted 13 Heat games this year. They are 2-11 in those games, with an Offensive Rating of 99.1 and Defensive Rating of 109.4. Their combined opponent’s win percentage in those games is .614, so it’s a decent smattering of Miami losing and losing to elite teams. In those games, the team breakdown is as follows:

Pos: Possesions played, OC: Opportunities Created, FD: Fouls Drawn

Here we can see the nosedive that Miami’s role players have taken in these games. It’s hard to say which is worse for them, the point guard position or the center position. In all likelihood, Miami doesn’t have a point or a center that would play relevant minutes on any other contender in the league. Not a one. Joel Anthony and Erick Dampier have at least been around average on defense.

But the shooting in these games from the rest of the supporting cast borders on offensive: Mario Chalmers is the only other player over 50% True Shooting, and still clocking in at about 2% lower than league average. Mike Miller has been dreadful in these games. Excluding Wade and James, Miami is shooting 31% from downtown and making just 3.7 3-pointers per game in this sample (season averages 33.7% and 6.7, respectively).

Chris Bosh’s performance also drastically falls off (even if we exclude the 1-18 disaster). They have almost zero production from their bench, with no one outside of the all-stars averaging north of 10 points per 36 minutes. To put that in perspective, nearly eighty percent of the NBA scores at least 10 points per 36 minutes.

Unless Miami can get something — average outside shooting? — from the role players and a better Chris Bosh, it’s not going far in the playoffs, regardless of what Wade and James do.